Wolfe Wave Pattern: Rules, How to Trade It, Targets and Reliability
A Wolfe Wave is a five-point reversal pattern: price swings in a converging wedge, point 5 overshoots the line drawn through points 1 and 3, and price then reverses toward the line through points 1 and 4 (the EPA target). Bullish waves form in falling wedges, bearish in rising wedges. Enter near point 5 with a stop beyond it. In Bulkowski's tests the 1–4 target was reached in 41% of bullish and 35% of bearish patterns.
Most chart patterns tell you where to enter; the Wolfe Wave claims to tell you the entry, the target and the timing from one drawing. The geometry is elegant — five swings, an overshoot, a projected line — and the overshoot at point 5 is the same liquidity grab smart-money traders look for. This guide covers the rules, the trade, the statistics and the common mistakes.
Indicators that prove themselves in public.
One engine, four precision tools — the Gold (XAU) Scalper, the institutional Gravity Zone, the Zeno momentum Oscillator, and Zeno Stocks for equities.



What is a Wolfe Wave?
A Wolfe Wave is a five-point reversal pattern in which price swings inside a converging wedge, overshoots the wedge's boundary at point 5 and then reverses toward a target drawn from point 1 through point 4. The bullish version forms in a falling wedge and points to a rally; the bearish version forms in a rising wedge and points to a decline. The method is named after Bill Wolfe, who described it as a pattern he discovered in price, not one he invented, and who taught it through his own service.
Its appeal is that it gives everything a trader needs from the drawing itself: where to enter (point 5), where the move should go (the 1–4 line, the "estimated price at arrival") and roughly when (where the wedge lines meet, the "estimated time of arrival"). Its weakness is that the target is reached less often than its fans suggest. This guide covers the rules, how to trade it, what the statistics show and a checker for your own points.
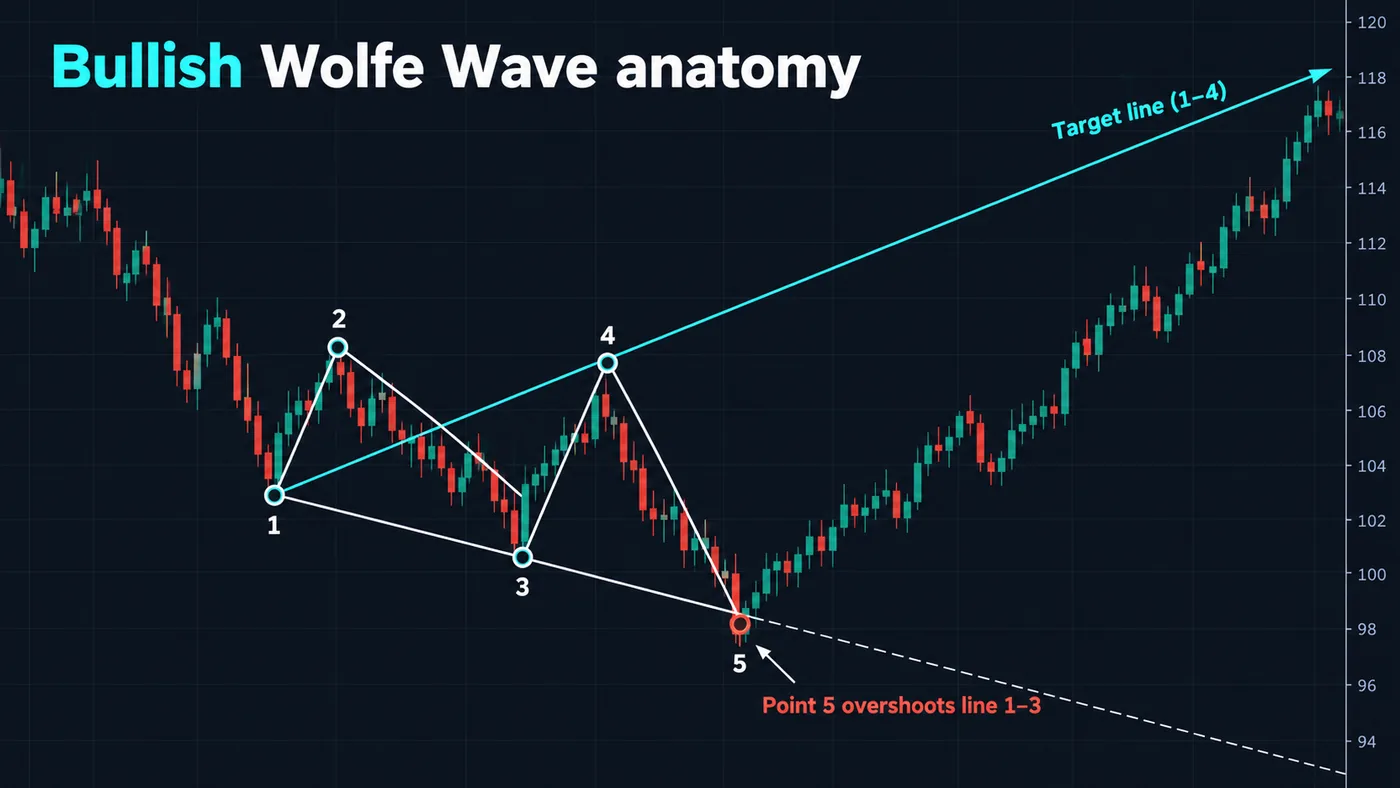
What are the rules of a Wolfe Wave?
| Point | Bullish Wolfe Wave | Bearish Wolfe Wave |
|---|---|---|
| 1 | A low | A high |
| 2 | A peak after point 1 | A trough after point 1 |
| 3 | A low below point 1 | A high above point 1 |
| 4 | A peak below point 2 but above point 3 | A trough above point 2 but below point 3 |
| 5 | A low beyond the 1–3 line (the overshoot) | A high beyond the 1–3 line |
| Lines | 1–3 and 2–4 converge (falling wedge) | 1–3 and 2–4 converge (rising wedge) |
| Target | 1–4 line projected forward | 1–4 line projected forward |
Thomas Bulkowski adds two clean-up rules: no peak above point 4 between points 3 and 5, and no valley below point 3 between points 2 and 4 (mirrored for the bearish version). Many practitioners also look for rough symmetry — waves 3–4 and 4–5 of similar duration — and treat a pattern that is wildly lopsided as suspect. The overshoot at point 5 is the defining feature: price runs beyond the 1–3 line, triggers the stops and breakout orders resting there, and then reverses. That is why the pattern is often described with Newton's line about every action having an equal and opposite reaction.
What does a bearish Wolfe Wave look like?
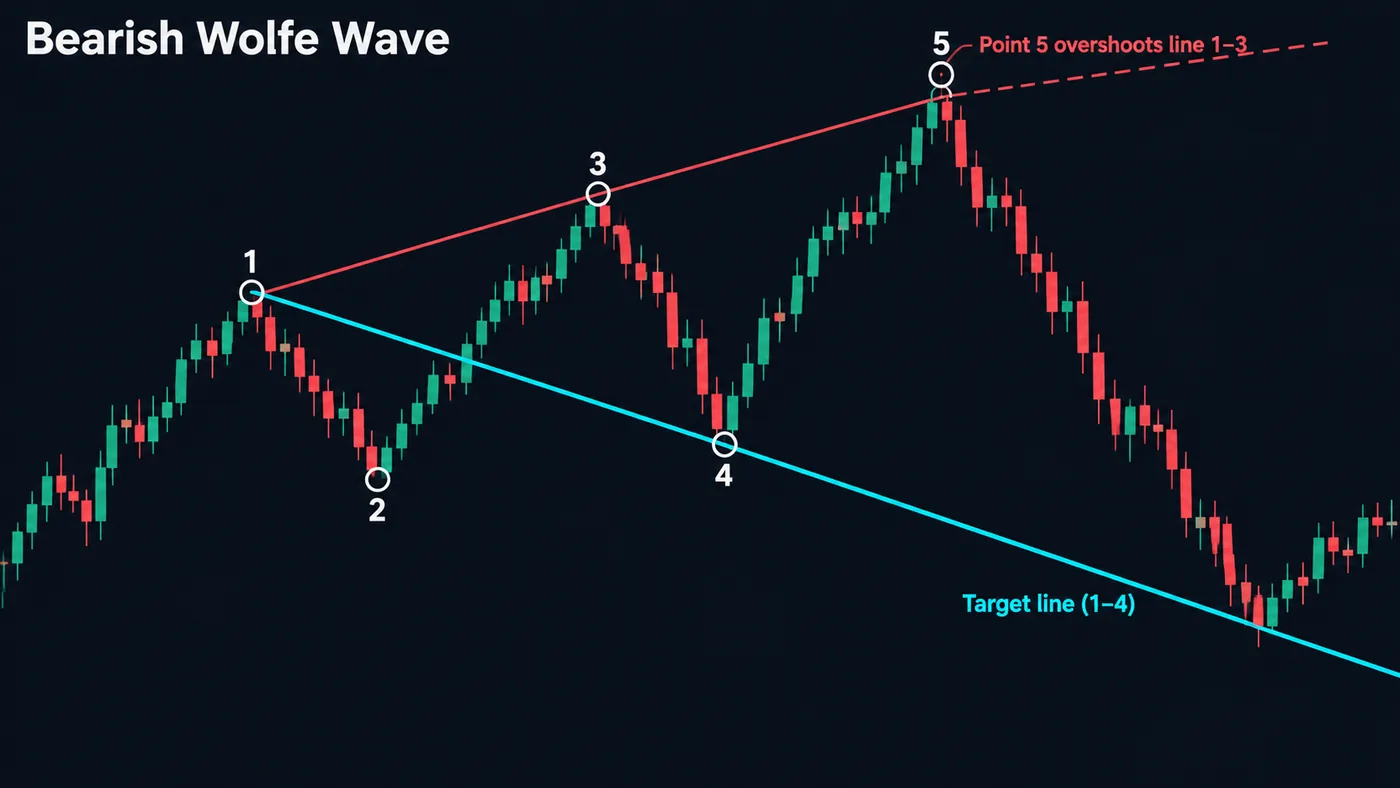
The bearish Wolfe Wave is the mirror image: rising highs at points 1, 3 and 5 and rising lows at 2 and 4 form a rising wedge; point 5 pokes above the 1–3 line — often looking like a breakout — and then fails, with the 1–4 line sloping down as the target. Because it forms where breakout traders are buying, it overlaps with the classic rising wedge and with a liquidity sweep above the highs; the bullish version overlaps with the falling wedge.

Automate your trades. Let Quantum Algo trade for you.
Every signal executed on your own account — on your account, with the plan you define.
How do you trade a Wolfe Wave?
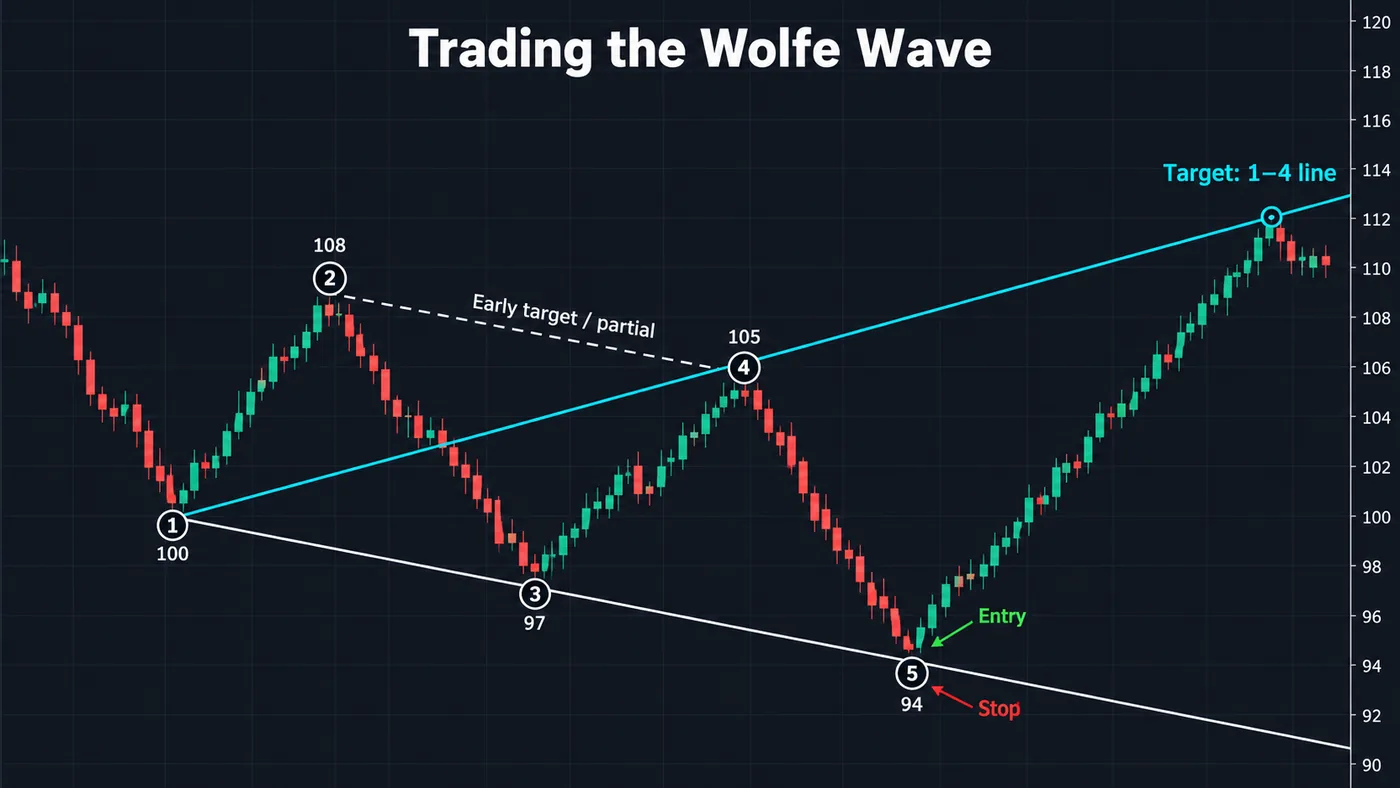
- Draw points 1 to 4. Confirm the wedge: 1–3 and 2–4 converge and point 4 sits between points 2 and 3.
- Project the 1–3 line. Point 5 is expected just beyond it — the "sweet zone".
- Wait for point 5 to reject. A reversal candle or a structure shift on a lower timeframe after the overshoot, not just a touch.
- Enter near point 5. The closer to point 5, the better the risk-to-reward.
- Stop beyond point 5. If price keeps going, the pattern is wrong.
- Take profits in stages. A partial at the 2–4 line, the rest toward the 1–4 line (EPA).
The EPA (estimated price at arrival) is the 1–4 line; the ETA (estimated time of arrival) is the bar where the 1–3 and 2–4 lines intersect. Treat both as guides, not appointments: the 1–4 line slopes, so the target price depends on when price gets there. A market structure shift on the lower timeframe at point 5 is a practical confirmation that the overshoot has failed.
How reliable is the Wolfe Wave?
| Bulkowski statistics | Bullish | Bearish |
|---|---|---|
| Performance rank | 34 of 39 | 35 of 36 |
| Patterns tested | 6,269 | 7,086 |
| Reached the 1–4 line (EPA) | 41% | 35% |
| Stopped out | 49% | 57% |
| Average move | 35% rise | 12% decline |
| Average time to EPA | 14 days | 14 days |
Thomas Bulkowski tested thousands of Wolfe Waves on daily stock charts and ranked both versions near the bottom of the patterns he measured: the 1–4 target was reached in 41% of bullish and 35% of bearish patterns, and roughly half were stopped out. He tested a bare-bones definition, without volume, slope or trend filters, and Wolfe implied extra selection rules of his own — so better filtering can improve the numbers. The honest conclusion is the same as for most patterns: the drawing is a framework for risk and targets, and the edge comes from where and how it forms.
Wolfe Wave checker
Enter the bar number and price of points 1 to 5. The checker decides whether the pattern is bullish or bearish, checks the rules, measures point 5 against the 1–3 line, finds the ETA where the wedge lines meet and projects the 1–4 line to that bar for the EPA — plus the 2–4 line as an early target. The sample is a bullish pattern.
Wolfe Wave vs other patterns
| Pattern | Points | Key difference |
|---|---|---|
| Wolfe Wave | 5 | Overshoot at point 5; target on the 1–4 line |
| Falling / rising wedge | 4+ | Breakout from the wedge; no overshoot required; target from wedge height |
| Elliott Wave ending diagonal | 5 | Part of a wave count; similar wedge shape |
| ABCD / harmonic patterns | 4–5 | Fibonacci ratios between legs; reversal zone instead of a 1–4 line |
| Quasimodo | 5 | Structure break then return to the left shoulder; no wedge |
What mistakes do traders make with Wolfe Waves?
- Forcing points onto a chart where the 1–3 and 2–4 lines do not converge.
- Entering before point 5 has overshot the 1–3 line and rejected.
- Placing point 4 outside the range between points 2 and 3.
- Treating the 1–4 line as a certainty when it is reached well under half the time in Bulkowski's tests.
- No stop beyond point 5 — when the overshoot keeps going, it becomes a breakout.
Reference data
| Item | Value |
|---|---|
| Named after | Bill Wolfe |
| Points | 5 |
| Shape | Converging wedge (falling for bullish, rising for bearish) |
| Entry | Near point 5, after the overshoot of the 1–3 line |
| EPA (target) | The 1–4 line |
| ETA (timing) | Where lines 1–3 and 2–4 intersect |
| EPA hit rate (Bulkowski) | 41% bullish, 35% bearish |
How does the Wolfe Wave fit with Quantum Algo's indicators?
The Wolfe Wave is a geometry of swing points, and the overshoot at point 5 is a liquidity grab. The free Quantum Algo indicators mark swing points, structure breaks and liquidity on TradingView, which makes points 1–4 easier to identify and the sweep at point 5 easier to see. Zeno, the premium engine, prints its own buy and sell signals with an entry, a stop and two targets, and every call is on the public track record.
The Wolfe Wave is a five-point wedge reversal: point 5 overshoots the 1–3 line and price reverses toward the 1–4 line. It gives a clear entry, stop and target, but the full target is reached less than half the time in Bulkowski's tests — so wait for rejection at point 5, keep the stop beyond it and take profits in stages.
◆ Interactive check
Can you spot a Wolfe Wave?
Questions traders ask about the Wolfe Wave
A five-point reversal pattern in a converging wedge in which point 5 overshoots the 1–3 line and price then moves toward the line drawn through points 1 and 4.
It is named after Bill Wolfe, who said he discovered the pattern in price rather than invented it, and taught it through his own service.
Mark the five swing points, draw the 1–3 line and the 2–4 line (they must converge), then draw the 1–4 line and extend it to the right as the target.
Estimated price at arrival: the 1–4 line, used as the target.
Estimated time of arrival: the bar where the 1–3 and 2–4 lines intersect, used as a rough timing guide.
Moderately. Thomas Bulkowski found the 1–4 target was reached in 41% of bullish and 35% of bearish patterns in a bare-bones test, ranking both near the bottom of the patterns he measured. Filters and confirmation improve results.
Beyond point 5: below it for a bullish wave, above it for a bearish one.
It forms inside one, but a wedge trade waits for a breakout, while the Wolfe Wave trades the failed overshoot at point 5 and targets the 1–4 line.
There are community scripts that detect Wolfe Waves automatically. They are useful for scanning, but check each drawing against the rules before trading it.
Bulkowski's statistics come from daily charts; the geometry works on any timeframe, but lower timeframes produce more false patterns.
References & Related Guides
Read next
- Falling Wedge Pattern
- Rising Wedge Pattern
- Elliott Wave Theory
- Harmonic Patterns
- ABCD Pattern
- Quasimodo Pattern
- Liquidity Sweep Trading
- Market Structure Shift
- Zig Zag Indicator
- Chart Patterns
- Free TradingView indicators
- Zeno — the premium engine