Monte Carlo Simulation for Trading: Drawdown, Risk of Ruin and Position Size
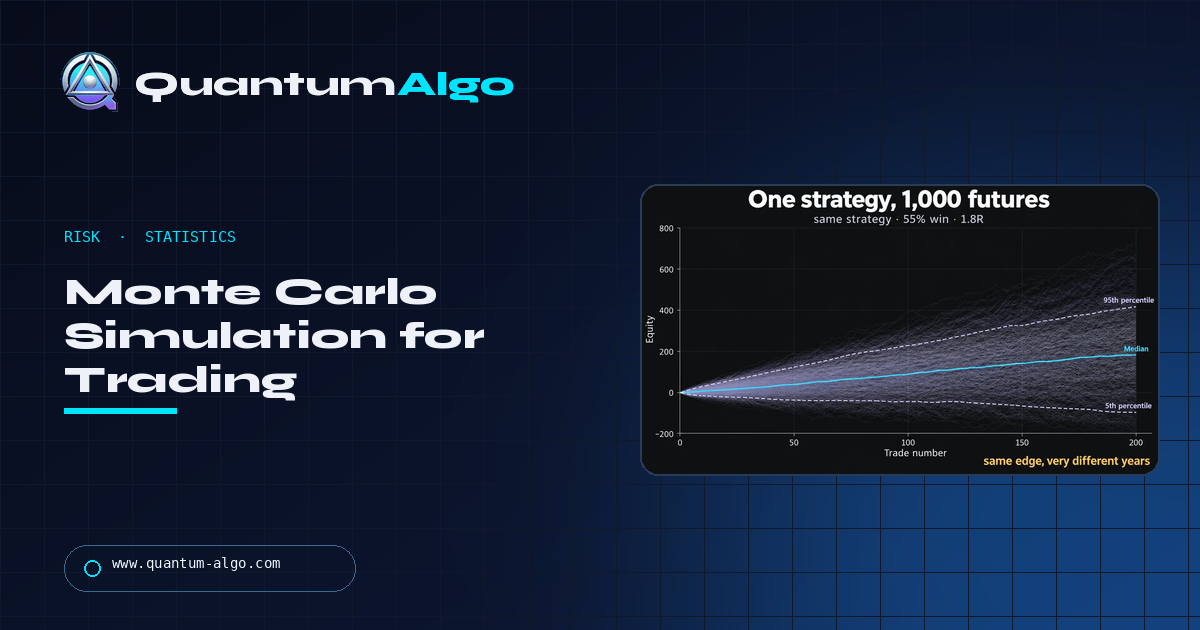
A Monte Carlo simulation reshuffles your strategy’s trades thousands of times to show the full range of equity curves and drawdowns the same edge can produce. It does not predict returns; it tells you how deep the losing stretches can get and how often — which is what decides your position size. Run one on the simulator below.
The most useful chart I ever showed a subscriber was not a trade — it was a thousand versions of his own strategy, fanned out, with a fifth of them still underwater after two hundred trades. He had a real edge and was sizing it like a lottery ticket. This page is that chart, the histogram behind it, and a simulator so you can run your own numbers before the market runs them for you.
Indicators that prove themselves in public.
One engine, four precision tools — the Gold (XAU) Scalper, the institutional Gravity Zone, the Zeno momentum Oscillator, and Zeno Stocks for equities.



What does a Monte Carlo simulation tell you that a backtest cannot?
A backtest gives you one history: the trades happened in one order and produced one equity curve, one maximum drawdown and one final balance. A Monte Carlo simulation takes the same trades and reshuffles them thousands of times, so you see the whole family of equity curves that strategy could have produced with the luck arranged differently.
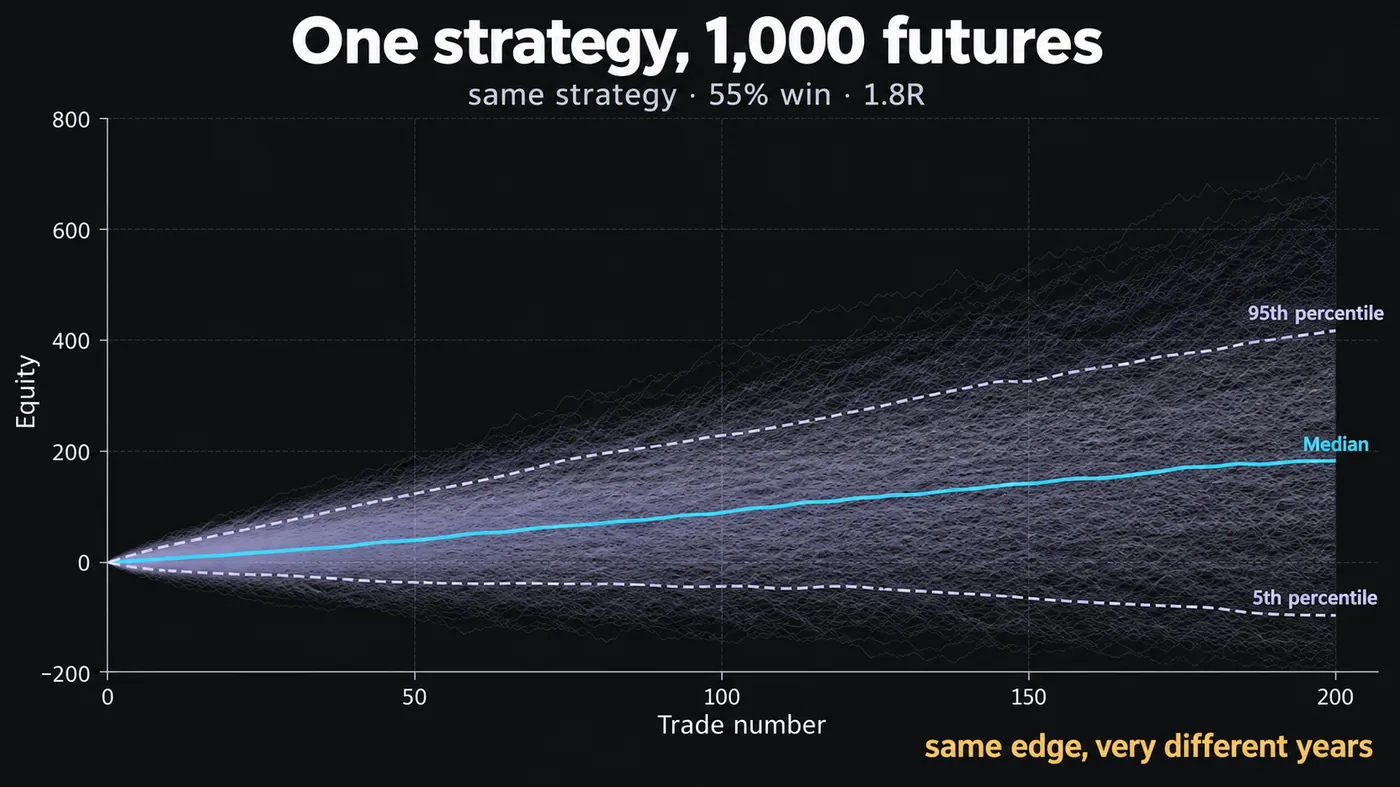
That matters because the order of trades is the one thing about your future you cannot know. A 55% win rate with a 1.8R average winner is a good strategy; the illustration at the top of this guide shows a thousand runs of exactly that strategy over 200 trades, and the 5th-percentile path is still underwater after 200 trades while the 95th-percentile path has tripled the median. Same edge. Same trades. Different years.
Once you have seen that fan, you stop asking "what was the drawdown?" and start asking "what drawdown should I expect, and how often?" — which is the question that decides position size.
How the simulation works, in plain terms
The method needs three inputs and does one thing repeatedly:
- A list of trade outcomes in R-multiples — or a win rate plus an average win and loss if you do not have the list.
- A number of trades per run, usually the length of the period you care about (a year of your trading, say 150–300 trades).
- A number of runs, usually 1,000 to 10,000.
For each run it draws trades at random from the list (with replacement), strings them into an equity curve, records the final result and the deepest drawdown, and moves to the next run. At the end you have 1,000 final balances and 1,000 max drawdowns, and you read them as distributions: the median, the 5th and 95th percentiles, and the fraction that crossed whatever line you call ruin.
There is no forecasting in it. It does not know what the market will do; it only knows what your strategy does when the same outcomes arrive in a different order. That limitation is also its strength — it cannot be curve-fitted.
Reading the drawdown distribution
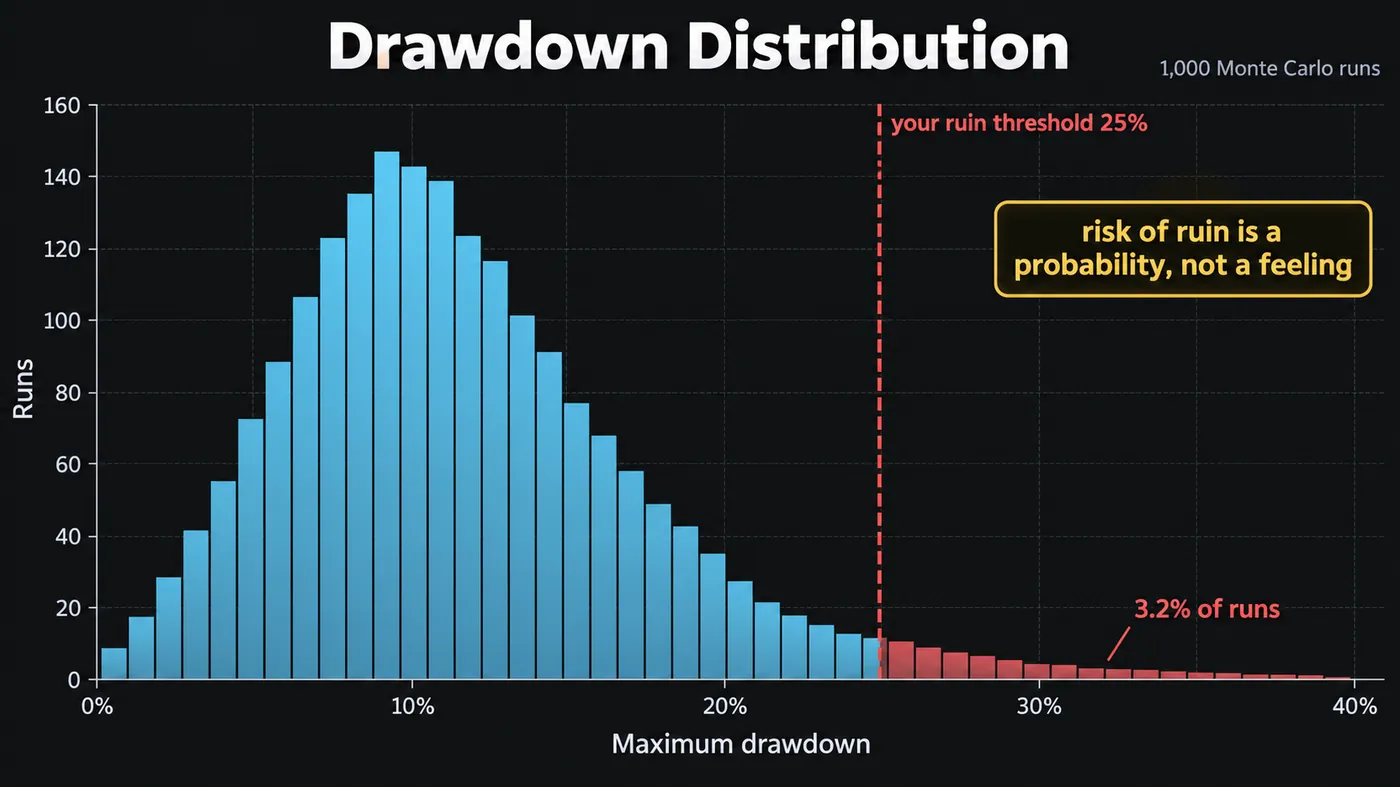
The histogram in this guide is the output that changes behaviour. One thousand runs of the 55%/1.8R strategy at 1% risk per trade: the bulk of the runs top out between 8% and 12% drawdown, the tail stretches to 35%, and 3.2% of the runs crossed a 25% drawdown.
Three things to take from it:
- The backtest's single drawdown number is one draw from this distribution, and you have no idea whether it was a lucky one.
- "Risk of ruin" stops being a slogan. If your funded-account limit is 25%, this strategy at this size fails the account roughly one year in thirty. That is a number you can decide about.
- The right-hand tail is long. Median outcomes are reassuring; tails are what end trading careers.
Position size changes the tail, not the expectancy
The three-panel illustration is the most useful picture on this page. Same strategy, same 1,000 runs, risk per trade set to 0.5%, 1% and 2%:
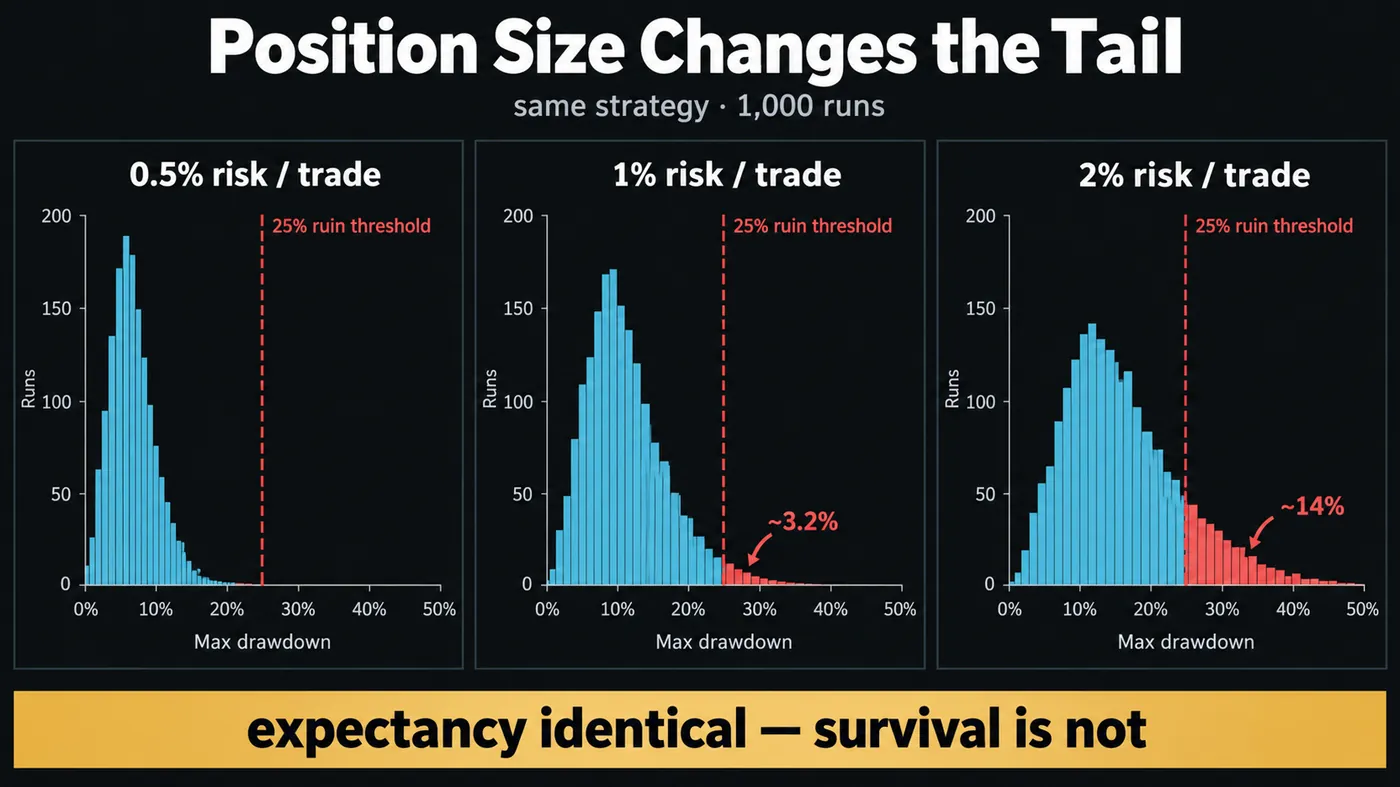
- At 0.5% the distribution sits around 5% drawdown and essentially nothing crosses 25%.
- At 1% it centres around 10% and about 3% of runs cross 25%.
- At 2% it centres around 15% and roughly 14% of runs cross 25%.
Expectancy per trade is identical in all three. Doubling the size did not double the risk of ruin — it multiplied it by more than four. This is the non-linearity that makes "just size up, the edge is positive" such an expensive sentence, and it is why our position sizing guide treats the risk percentage as a survival parameter rather than a return dial.

Automate your trades. Let Quantum Algo trade for you.
Every signal executed on your own account — on your account, with the plan you define.
Setting a ruin threshold that matches your reality
Ruin is not zero. Ruin is the drawdown at which you stop being able to execute the strategy as designed:
- Funded account: the programme's max drawdown, typically 5% daily and 10% total on evaluation, wider on funded. Use those numbers exactly.
- Own capital: the drawdown at which you know you would start changing rules — for most people that is somewhere between 20% and 30%, well before the account is empty.
- Managed money: whatever the mandate says, minus a buffer.
Run the simulation with that line drawn and read the tail fraction. Anything above about 5% of runs is a size problem, not a strategy problem, and the fix is in the previous section.
The three inputs that break the simulation
Monte Carlo is honest about order and dishonest about everything else if you feed it badly.
Too few trades. Thirty trades give you thirty outcomes to draw from; the simulation will happily produce a beautiful fan from them, but the fan is built on a sample that could not distinguish a 55% strategy from a 45% one. Below about a hundred trades, treat the output as a sketch. The BTCUSDT chart at the top of this guide is a good illustration of the problem: five regime labels in six months is a real pattern and far too few observations to simulate — you need the ledger behind them, not the picture.
Serial correlation. Real losing streaks cluster around regime changes; random resampling scatters them evenly. If your strategy loses in chop and wins in trends, the simulated tail will be too kind. The fix is block resampling — draw runs of five or ten consecutive trades instead of single trades — which most spreadsheet setups can do and the tool below does.
Costs left out. If the trade list is gross of fees, slippage and funding, every run inherits the optimism. Use net R-multiples; our profit calculator guide shows how to net them.
Monte Carlo versus walk-forward: different questions
People treat them as competing methods. They answer different questions.
Walk-forward asks: do the rules still work on data they were not fitted to? It is a test of the edge.
Monte Carlo asks: given that the rules work, how badly can it go before it goes well? It is a test of the sizing.
The order is walk-forward first, Monte Carlo second, and the free algorithmic trading course puts them in that order in weeks seven and eight for exactly this reason.
Running one yourself
The simulator on this page is enough for a first look: enter win rate, average win, average loss, trades per run and risk per trade, and it draws the equity fan and drawdown histogram in the browser. For your own trade list, a spreadsheet works: paste the R-multiples in a column, use a random index to resample, cumulate, and record the drawdown per run — a thousand runs is a few minutes of recalculation. Python users can do it in twenty lines with numpy; the backtesting guide has the pattern.
Whichever tool you use, write down the three numbers before you trust a strategy: median final R, 5th-percentile final R, and the fraction of runs past your ruin line.
A backtest is one draw; Monte Carlo shows the deck. Read the median, the 5th percentile and the fraction of runs past your ruin line, feed it net trades and at least a hundred of them, use block resampling if your losses cluster, and treat the risk percentage as a survival dial — the expectancy does not change when you size up, but the tail does.
◆ Interactive check
What does the fan actually tell you?
Questions traders ask about Monte Carlo simulation
At least a hundred real trades before the output is more than a sketch; three hundred or more before the tails are worth arguing about. The number of simulated runs matters less than the number of real trades feeding them.
No. It tells you the range of outcomes your existing edge can produce when the same trades arrive in a different order. If the edge disappears, so does everything the simulation says.
It does not recommend; it shows the tail. For most strategies with a 50–60% win rate and a 1.5–2R winner, 0.5–1% per trade keeps the 25%-drawdown tail under a few percent of runs. Above 2% the tail grows faster than the returns.
It is the right tool for it: set the ruin line at the programme's drawdown limit, simulate a challenge-length run, and read the pass and fail probabilities before paying the fee.
Resampling trade outcomes with replacement is a bootstrap; Monte Carlo is the broader family of simulations that includes it. In trading the two words are used for the same procedure.
Not natively. The Strategy Tester gives one equity curve. Export the list of trades and resample it in a spreadsheet, in Python, or with the simulator on this page.
It depends on your ruin line, not on a universal number. If your limit is 10%, a median drawdown of 10% means half your futures fail — size down until the 95th percentile sits inside the limit.
Yes, if you have a logged trade list with R-multiples. It is often more useful for discretionary traders because they rarely have a backtest to look at.
Zeno’s signals are published on TradingView as a ledger — 160 posted trades, each with its outcome — which is exactly the input a Monte Carlo test needs. Subscribers resample that list at their own risk percentage before deciding how to size the signals.
References & Related Guides
Read next
- What Is Quantitative Trading? Rules, Data and Who Actually Does It
- How Many Trading Days Are in a Year? (2026 Calendar, by Market, Calculator)
- Position Sizing: The Complete Guide
- Backtesting Trading Strategies
- Free Algorithmic Trading Course
- Trading Profit Calculator
- Drawdown Recovery (Academy)
- Trading Journal: Complete Guide
- Apex Trader Funding Review
- Risk Management: Complete Guide
Authoritative sources
- Investopedia: Monte Carlo simulation
- NumPy: random resampling (Generator.choice)
- CME Group: risk management basics
- TradingView: Strategy Tester (single equity curve)
- Bootstrapping (statistics) — resampling with replacement