Lorentzian Classification: The Complete Machine-Learning Guide
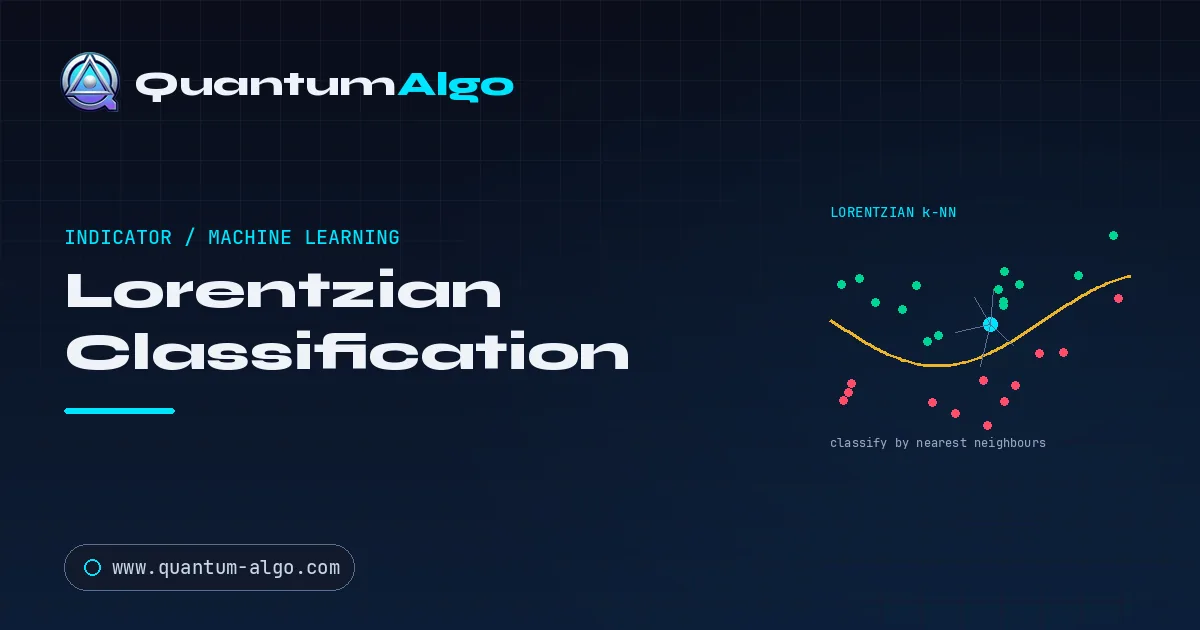
Lorentzian Classification is a k-nearest-neighbors indicator that finds the historical bars most similar to the current one and predicts direction from how those neighbors resolved. It measures similarity with Lorentzian distance instead of Euclidean, which compresses extreme readings so volatile markets distort the search less. The number of neighbors, k, sets sensitivity; adaptive versions adjust k to market conditions.
Lorentzian Classification is one of the most talked-about machine-learning indicators on TradingView, and for good reason: instead of the usual moving averages and thresholds, it treats trading like a pattern-recognition problem. It looks at the current market conditions, searches history for the most similar past situations, and classifies the likely next move based on what happened those times — using an unusual distance measure, the Lorentzian distance, that handles volatile markets more gracefully than ordinary geometry.
This guide explains what Lorentzian Classification actually is, how the k-nearest-neighbours idea and the Lorentzian distance work in plain language, what the features and settings mean, and how to use it sensibly without falling for the common "AI indicator" traps. It also walks through a live example using Quantum Algo's own Adaptive Lorentzian implementation so you can see the concept on a real chart.
What kind of model is Lorentzian Classification?
At its heart, Lorentzian Classification is a k-nearest-neighbours (k-NN) classifier applied to price. k-NN is one of the oldest and most intuitive machine-learning methods: to classify a new example, you find the k most similar past examples and let them vote. Applied to trading, each "example" is a snapshot of market conditions on a bar — described by a handful of indicator values — and the label is what price did next. The current bar is classified by finding the most similar historical bars and seeing whether they were mostly followed by up moves or down moves.
What makes this particular indicator distinctive is the choice of distance. To decide which past bars are "most similar," you need a way to measure the gap between two market snapshots. Most methods use Euclidean distance — ordinary straight-line geometry. Lorentzian Classification instead uses Lorentzian distance, a measure borrowed from the mathematics of spacetime, which compresses the effect of large differences. In practice this means extreme, volatile readings distort the similarity search less, so the neighbours it finds tend to be more genuinely comparable in turbulent markets.

Automate your trades. Let Quantum Algo trade for you.
Every signal executed on your own account — 24/7, hands-off.
How does k-nearest-neighbours classify the current bar?
The mechanics are easier to follow as a sequence. Each historical bar is stored as a point in a "feature space" whose axes are the indicator readings on that bar. When a new bar forms, the model places it in that same space and measures the Lorentzian distance to every stored point. It keeps the k closest — the nearest neighbours — and looks at how price resolved after each of them. If most of those similar past situations were followed by an up move, the current bar is classified bullish; if most led to down moves, bearish.
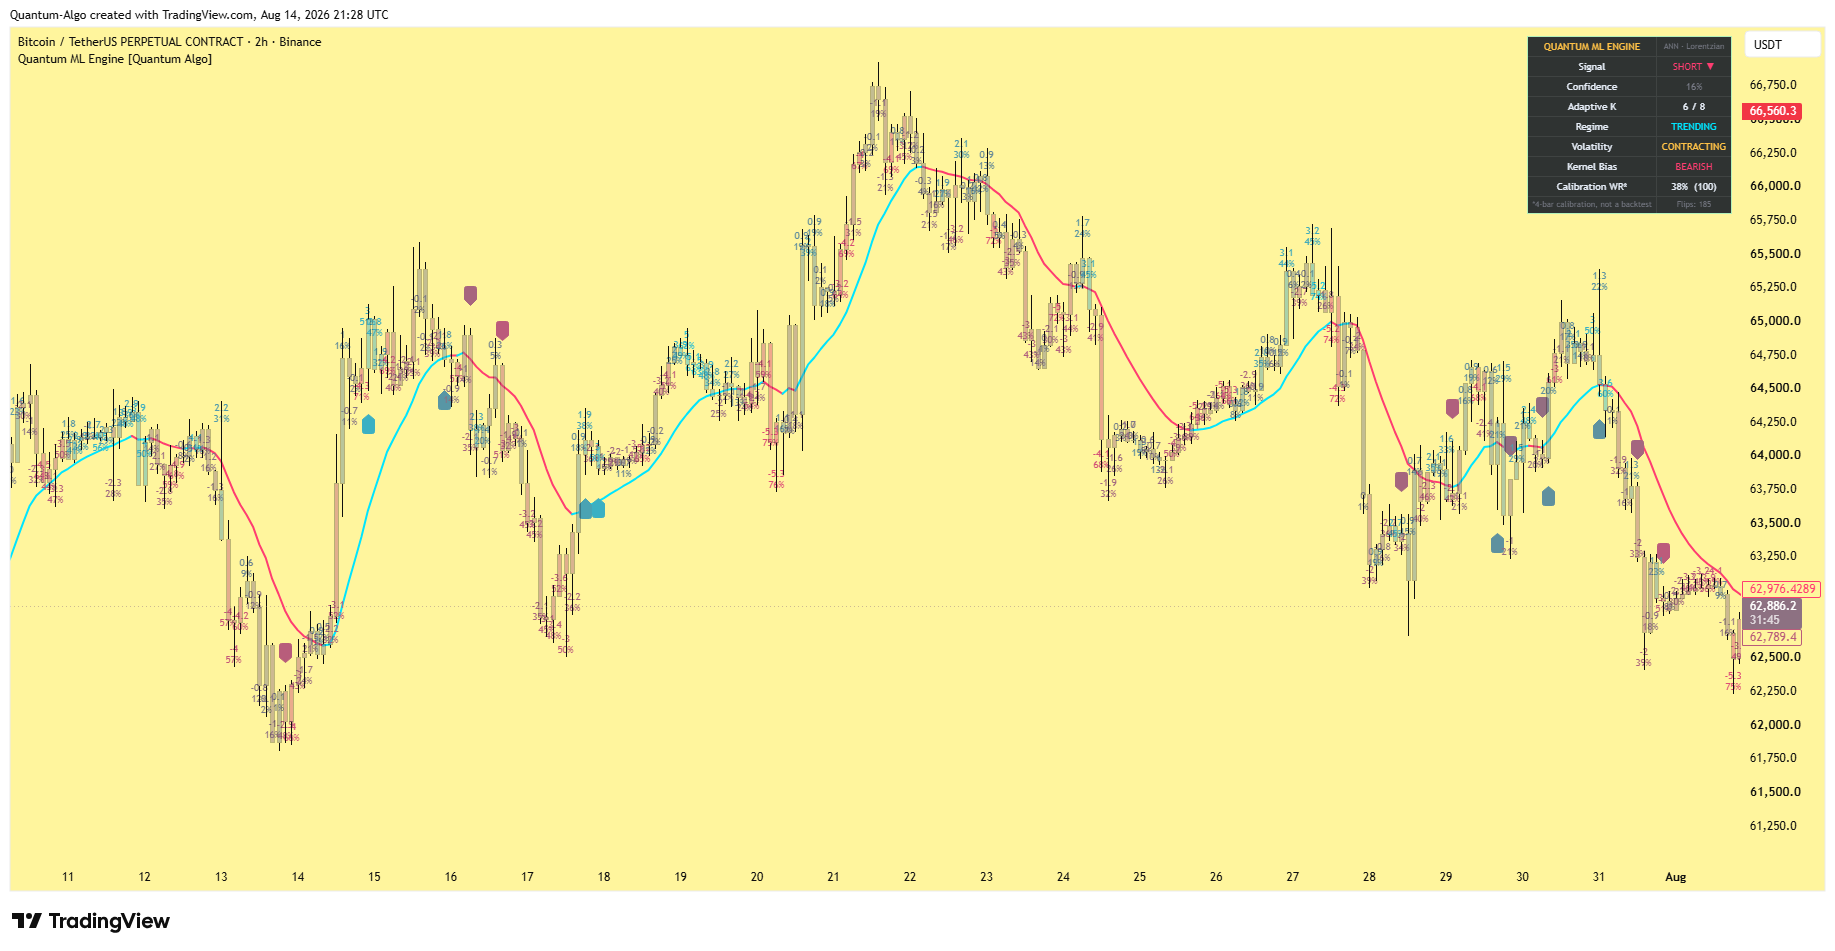
The number k matters. A small k makes the model sensitive and reactive but noisy; a large k smooths the vote but can blur genuine signals. This is exactly why adaptive implementations, like AI-clustered Supertrend, adjust k to conditions rather than fixing it — the Quantum ML Engine in the chart above shows an "Adaptive K" of 6/8, meaning it is currently using six of a possible eight neighbours based on the market state. The classification you see is the aggregated vote of those historical analogues.
Classifying the current bar by its neighbours
Find the k most similar historical bars, then vote on direction from how they resolved.
Why measure similarity with Lorentzian, not Euclidean, distance?
The distance metric is the heart of what makes this indicator different, so it is worth understanding intuitively. Imagine two market snapshots that are similar in most respects but differ sharply on one volatile reading — say a momentum spike. Euclidean distance squares differences, so that single large gap dominates the calculation and pushes the two snapshots far apart, even though they are alike in every other way. The model would then overlook a genuinely comparable historical bar.
Euclidean vs Lorentzian distance
Euclidean squaring lets one big gap dominate; Lorentzian grows only logarithmically, staying robust.
Lorentzian distance grows only logarithmically with large differences, so a single extreme reading does not blow up the similarity measure. Similar-but-volatile bars stay close together in the feature space, complementing tools like the Gaussian Channel, which means the nearest-neighbour search finds more truly analogous situations when markets are turbulent — exactly when reliable analogues are most valuable. This robustness to volatility and outliers is the whole reason the Lorentzian metric was chosen, and it is why the indicator often behaves more sensibly through chaotic price action than a plain-geometry classifier would.
Euclidean vs Lorentzian distance at a glance
| Property | Euclidean distance | Lorentzian distance |
|---|---|---|
| Per-feature term | Squared difference | Log of 1 plus the absolute difference |
| Growth with large gaps | Quadratic | Logarithmic |
| One extreme reading | Dominates the total distance | Compressed, cannot dominate |
| Similar bars in volatile markets | Pushed far apart | Kept close together |
| Neighbour search in turbulent markets | Finds fewer true analogues | Finds more analogous bars |
◆Both metrics work on the same normalised features; only the weighting of differences changes.
What does the model actually see on each bar?
A k-NN classifier is only as good as the features that describe each bar. Lorentzian Classification typically describes market conditions with a small set of normalised technical readings — commonly momentum and trend oscillators such as RSI, a Wave Trend or CCI-style measure, and ADX for trend strength. Each bar becomes a short list of these values, and that list is its coordinates in the feature space where similarity is measured.
The choice and number of features shape everything downstream. Too few and the model cannot distinguish meaningfully different situations; too many and the "curse of dimensionality" makes every bar look roughly equidistant, weakening the neighbour search. Good implementations keep the feature set compact, normalised, and complementary — each feature capturing a different aspect of the market — so that "nearest" in the feature space genuinely means "most similar" in market terms.
Momentum features
Readings like RSI or a Wave Trend oscillator capture whether the market is stretched or building energy, much like a squeeze momentum read — a core part of what makes two situations comparable.
Trend features
A trend-strength measure such as ADX tells the model whether a snapshot came from a trending or ranging environment, which strongly affects what happens next.
Normalisation
Features are scaled to comparable ranges so no single one dominates the distance purely because of its units — a prerequisite for any distance-based model.
Compact set
A handful of complementary features beats a large pile of correlated ones, keeping the neighbour search meaningful rather than diluted.
Reading the Quantum ML Engine dashboard
The chart above is Quantum Algo's Adaptive Lorentzian implementation, and its dashboard makes the model's internal state visible — which is a good way to learn what the indicator is doing. Each row is a live output of the classifier and its supporting logic, so you can see not just a signal but the context behind it.
What each dashboard row tells you
The signal is the vote; the other rows tell you how much to trust it and what regime produced it.
The most important habit is to read the signal in context. A short signal with low confidence in a contracting-volatility, trending regime is a very different proposition from a high-confidence signal as volatility expands. Notably, the Quantum ML Engine labels its win-rate figure as a short "calibration, not a backtest" — an honest reminder that a recent hit-rate over a small window is a health check on the model's current calibration, not a promise of future performance. Treating every readout as probabilistic context rather than a guarantee is the correct mindset for any ML indicator.
What is Lorentzian Classification good at, and where does it fail?
Used well, Lorentzian Classification has real strengths. It adapts to the actual data rather than assuming a fixed model of the market, its Lorentzian metric makes it robust in exactly the volatile conditions where simpler tools break, unlike a moving-average tool, and a good implementation gives a nuanced, probabilistic read complete with confidence and regime context. It is a genuinely different lens on the market from the usual moving-average toolkit.
But it is not magic, and honesty about its limits is what separates good users from disappointed ones. It is still pattern-matching on past data: if the future stops resembling the past — a genuine regime change with no historical analogue — its neighbours become misleading. It does not know why anything happens, only what tended to follow similar readings. It can be curve-fit through over-tuning — which is why honest backtesting matters, and like any indicator it can produce losing streaks. It is a high-quality probabilistic signal to combine with structure, context, and strict risk management — not a standalone oracle.
Should you trade Lorentzian signals on their own?
The productive way to use Lorentzian Classification is as a high-quality directional filter and context engine, not as a blind buy/sell trigger. Let the classifier tell you which side has the historical edge right now and how confident it is, then require your own confirmation before acting — a market-structure shift in the same direction, a key level, or a separate entry signal. The classification sets the bias; your structure and risk plan set the trade.
Turning the classifier into a filtered signal
Gate the raw classification with confidence and regime, then require your own confirmation.
It also pairs naturally with the same discipline any indicator demands: weight higher-confidence signals more, respect the regime and volatility context the dashboard provides, and size every trade with strict risk management so no single misclassification hurts. Because the Quantum ML Engine exposes confidence, regime, and volatility explicitly, you can build simple rules — for example, only taking signals above a confidence threshold in a trending regime — that turn a raw classifier into a disciplined, filtered system.
• Adaptive Lorentzian engine — Adaptive K, regime and volatility detection with confidence scoring
• Honest calibration — A transparent calibration read, explicitly not presented as a backtest
• Accountable performance — A verified public track record behind every signal
◆ Try the Adaptive Lorentzian engine
Quantum Algo's Adaptive Lorentzian Classification — the Quantum ML Engine shown above — brings adaptive K, regime and volatility detection, confidence scoring and honest calibration to your charts, layered with the same Smart Money Concepts context as the rest of the suite, all backed by a verified public track record.
View the script on TradingView → Verify the track recordFrequently Asked Questions
Lorentzian Classification is a machine-learning indicator that treats trading as a pattern-recognition problem. It uses a k-nearest-neighbours model to find the historical bars most similar to current conditions and classifies the likely next move based on how those similar past situations resolved. Its defining feature is the use of Lorentzian distance — rather than ordinary Euclidean distance — to measure similarity, which makes it more robust in volatile markets.
Each historical bar is stored as a point in a feature space whose axes are indicator readings such as RSI, a Wave Trend oscillator, and ADX. When a new bar forms, the model measures the Lorentzian distance from it to every stored bar, keeps the k closest 'nearest neighbours,' and looks at how price resolved after each. If most similar past bars were followed by up moves, the current bar is classified bullish; if most led to down moves, bearish. The signal is the aggregated vote of those historical analogues.
Lorentzian distance is a way of measuring how different two market snapshots are, borrowed from the mathematics of spacetime. Unlike Euclidean distance, which squares differences so a single large gap dominates, Lorentzian distance grows only logarithmically with large differences. This means one extreme, volatile reading does not blow up the similarity measure, so similar-but-volatile bars stay close together and the model finds genuinely comparable historical situations even in turbulent markets — which is exactly when reliable analogues matter most.
Yes, legitimately — k-nearest-neighbours is one of the oldest and most established machine-learning algorithms. It is 'machine learning' in the sense that it classifies new data by learning from labelled historical examples rather than following hand-coded rules. It is not, however, a neural network or a large model that 'understands' markets; it is a similarity-based classifier. That distinction matters: it is powerful and adaptive, but it is pattern-matching on history, not reasoning about cause.
K is the number of nearest neighbours the model uses to vote on the classification. A small K makes the indicator reactive but noisy; a large K smooths the vote but can blur real signals. 'Adaptive K' means the implementation adjusts this number based on market conditions rather than fixing it — for example, the Quantum ML Engine shows an Adaptive K of 6/8, meaning it is currently using six of a possible eight neighbours given the detected regime and volatility.
It typically describes each bar with a small set of normalised technical readings — commonly a momentum oscillator like RSI, a Wave Trend or CCI-style measure, and a trend-strength measure such as ADX. These become the bar's coordinates in the feature space where similarity is measured. Good implementations keep the feature set compact, normalised, and complementary, because too few features can't distinguish situations and too many trigger the 'curse of dimensionality' that makes every bar look equidistant.
A properly built version that classifies on closed bars does not repaint — once a bar closes, its features and classification are fixed. However, implementations vary, and some display real-time updates on the forming bar that settle when it closes. If you rely on the signals, verify the specific script by watching it form live and confirming historical classifications do not shift on reload. As with any indicator, trust only what holds up under closed-bar, real-time testing.
The calibration win rate is a recent hit-rate the model reports over a short window as a health check on its current calibration. Importantly, the Quantum ML Engine explicitly labels it as a calibration 'not a backtest' — an honest reminder that a hit-rate over a small recent sample is a gauge of how well the model is currently tuned, not a projection of future performance. It should be read as probabilistic context alongside the signal, confidence, regime, and volatility, never as a guarantee.
It is pattern-matching on past data, so if the future stops resembling the past — a genuine regime change with no historical analogue — its nearest neighbours become misleading and its edge weakens. It does not know why anything happens, only what tended to follow similar readings. It can be curve-fit through over-tuning, and like any indicator it produces losing streaks. It is best treated as a high-quality probabilistic signal to combine with market structure, context, and strict risk management — not a standalone oracle.
Use it as a directional filter and context engine rather than a blind trigger. Let the classifier tell you which side has the historical edge and how confident it is, then require your own confirmation — a market-structure shift in the same direction, a key level, or a separate entry signal — before acting. Because implementations like the Quantum ML Engine expose confidence, regime, and volatility explicitly, you can build simple rules such as only taking signals above a confidence threshold in a trending regime, turning a raw classifier into a disciplined system.
It is different rather than strictly better. Moving averages are simple, transparent, and lag by design; Lorentzian Classification is adaptive, robust to volatility, and gives probabilistic context with confidence and regime, but it is more complex and depends on history resembling the present. Many traders find them complementary — a moving-average or channel tool for clean trend context and a Lorentzian classifier for a nuanced directional read. Neither replaces structure and risk management.
Quantum Algo publishes an Adaptive Lorentzian Classification — the Quantum ML Engine shown in this guide — on TradingView. It adds adaptive K, regime and volatility detection, confidence scoring, and honest calibration on top of the core Lorentzian k-NN method, and layers the same Smart Money Concepts context as the rest of the suite. You can view the script directly on TradingView, and its signals are backed by Quantum Algo's verified public track record.
References & Related Guides
More in this topic
- Machine Learning Trading Indicators (Lorentzian): Complete Guide
- SuperTrend AI (Clustering): The Complete Guide
- AI Trading Journal: How to Use One to Actually Improve
- Gaussian Channel Indicator Guide
- Best TradingView Indicators
- Non-Repaint Indicators: The Complete Guide to Reliable Signals
- RSI Indicator Guide
- Squeeze Momentum Indicator (TTM Squeeze): Complete Guide
- Best Buy/Sell Indicator: How to Choose One That Actually Works
- Backtesting Trading Strategy — Complete Validation Guide
- Smart Money Concepts (SMC): Ultimate Trading Guide
- Trend Trading Strategy: The Complete Guide
- Best Trading Bots — Ranked: Automate Your Trading
- Supertrend Indicator Guide
Core reading
- Machine Learning Trading Indicators (Lorentzian): Complete Guide
- Best TradingView Indicators
- Risk Management in Trading — The Complete Survival Guide
- All Premium Guides
- Public Track Record
- Quantum Algo on TradingView