Quantum Algo Zeno
Zeno Oscillator indicator complete guide. Multi-factor confluence scoring, signal generation logic, and integration with the QuantumAlgo SMC suite.
A multi-layered momentum oscillator with tiered signal hierarchy, built-in risk management, and real-time trade tracking.
What Is Zeno?
Zeno is a momentum-based oscillator that lives in a separate pane below your price chart. It combines five independent technical engines into a single unified indicator, producing a three-tier signal hierarchy — from early momentum shifts to high-conviction reversal confirmations.
Unlike standalone oscillators, Zeno doesn't just tell you when something is overbought or oversold. It cross-references momentum, volatility, multi-timeframe alignment, and machine learning clustering to filter noise and surface only the signals that matter.
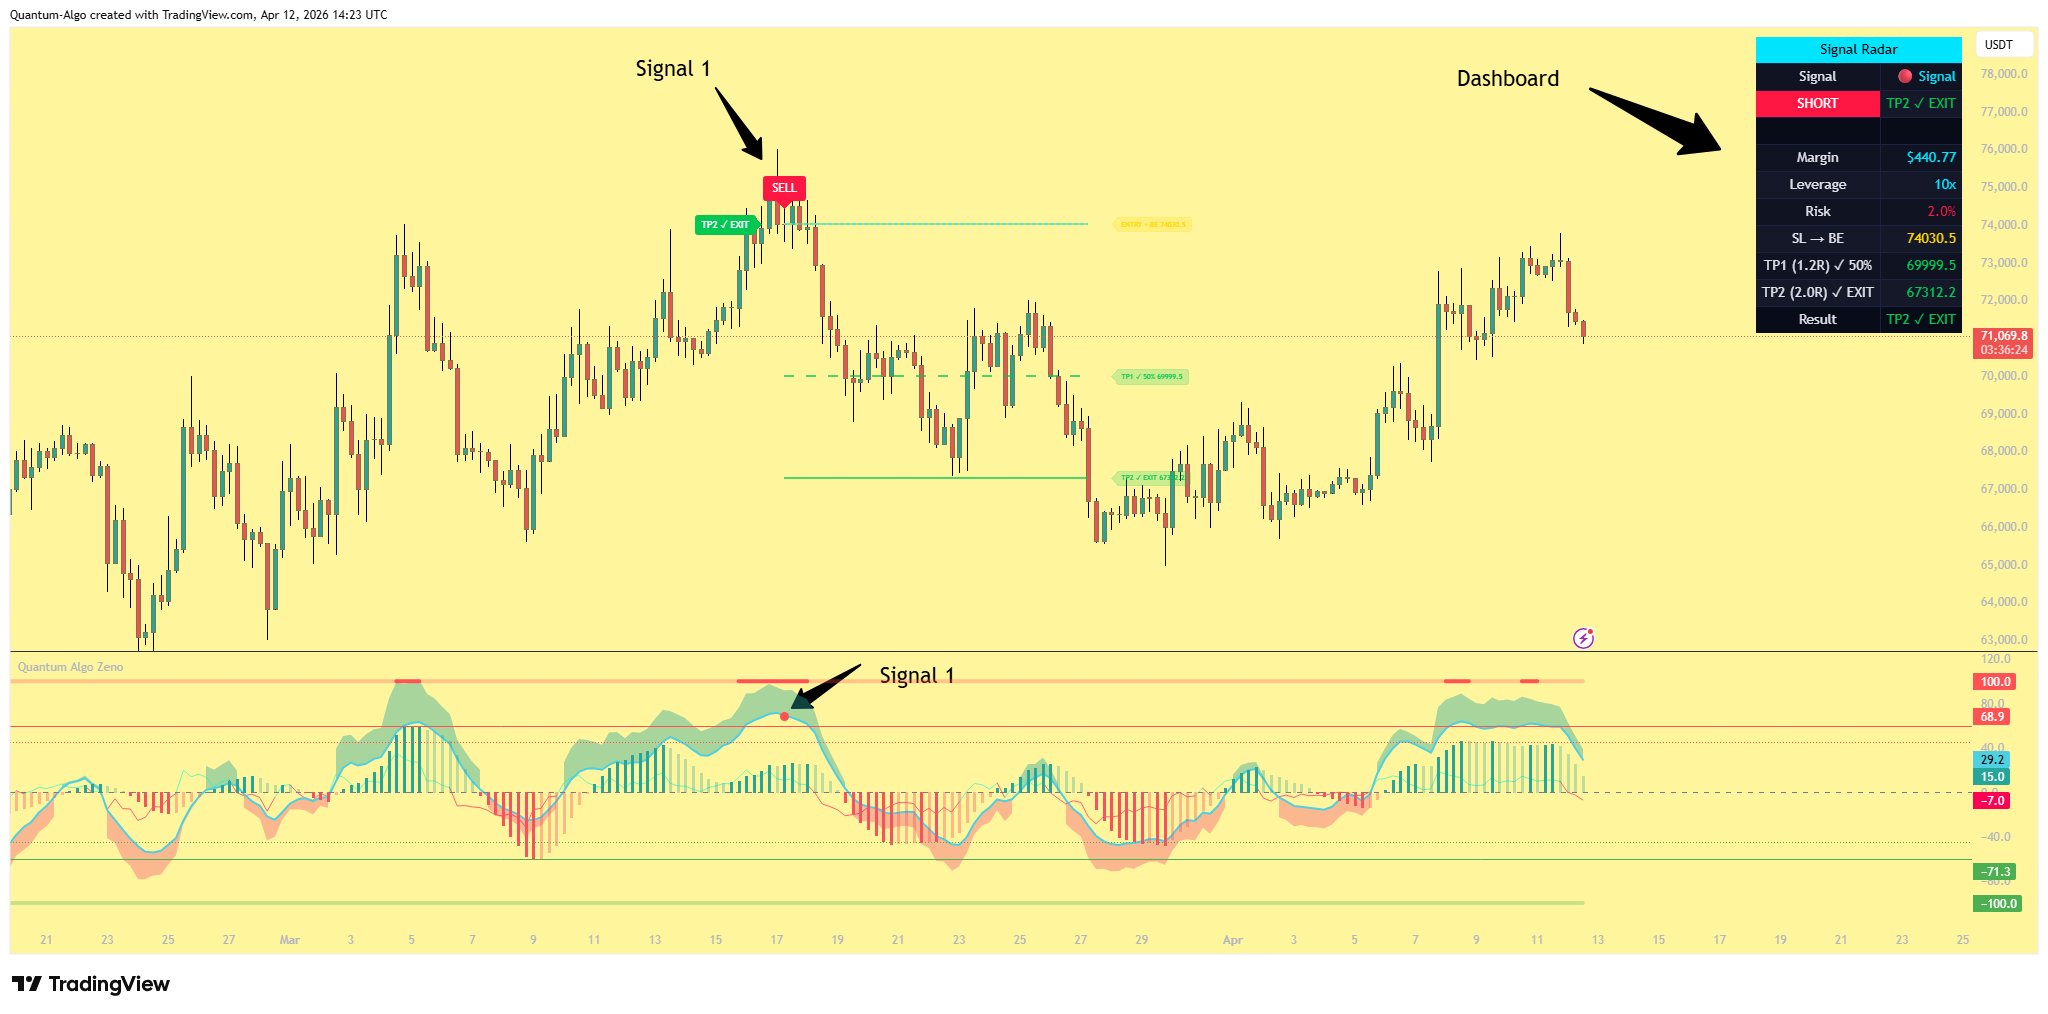
Every signal comes with a Signal Radar dashboard displayed on the price chart, complete with position sizing, margin calculation, stop-loss, take-profit levels, and real-time trade outcome tracking.
Five Core Components
Zeno is built from five technical analysis engines, each contributing a different dimension of market analysis. They work independently but are cross-referenced to produce the signal hierarchy.
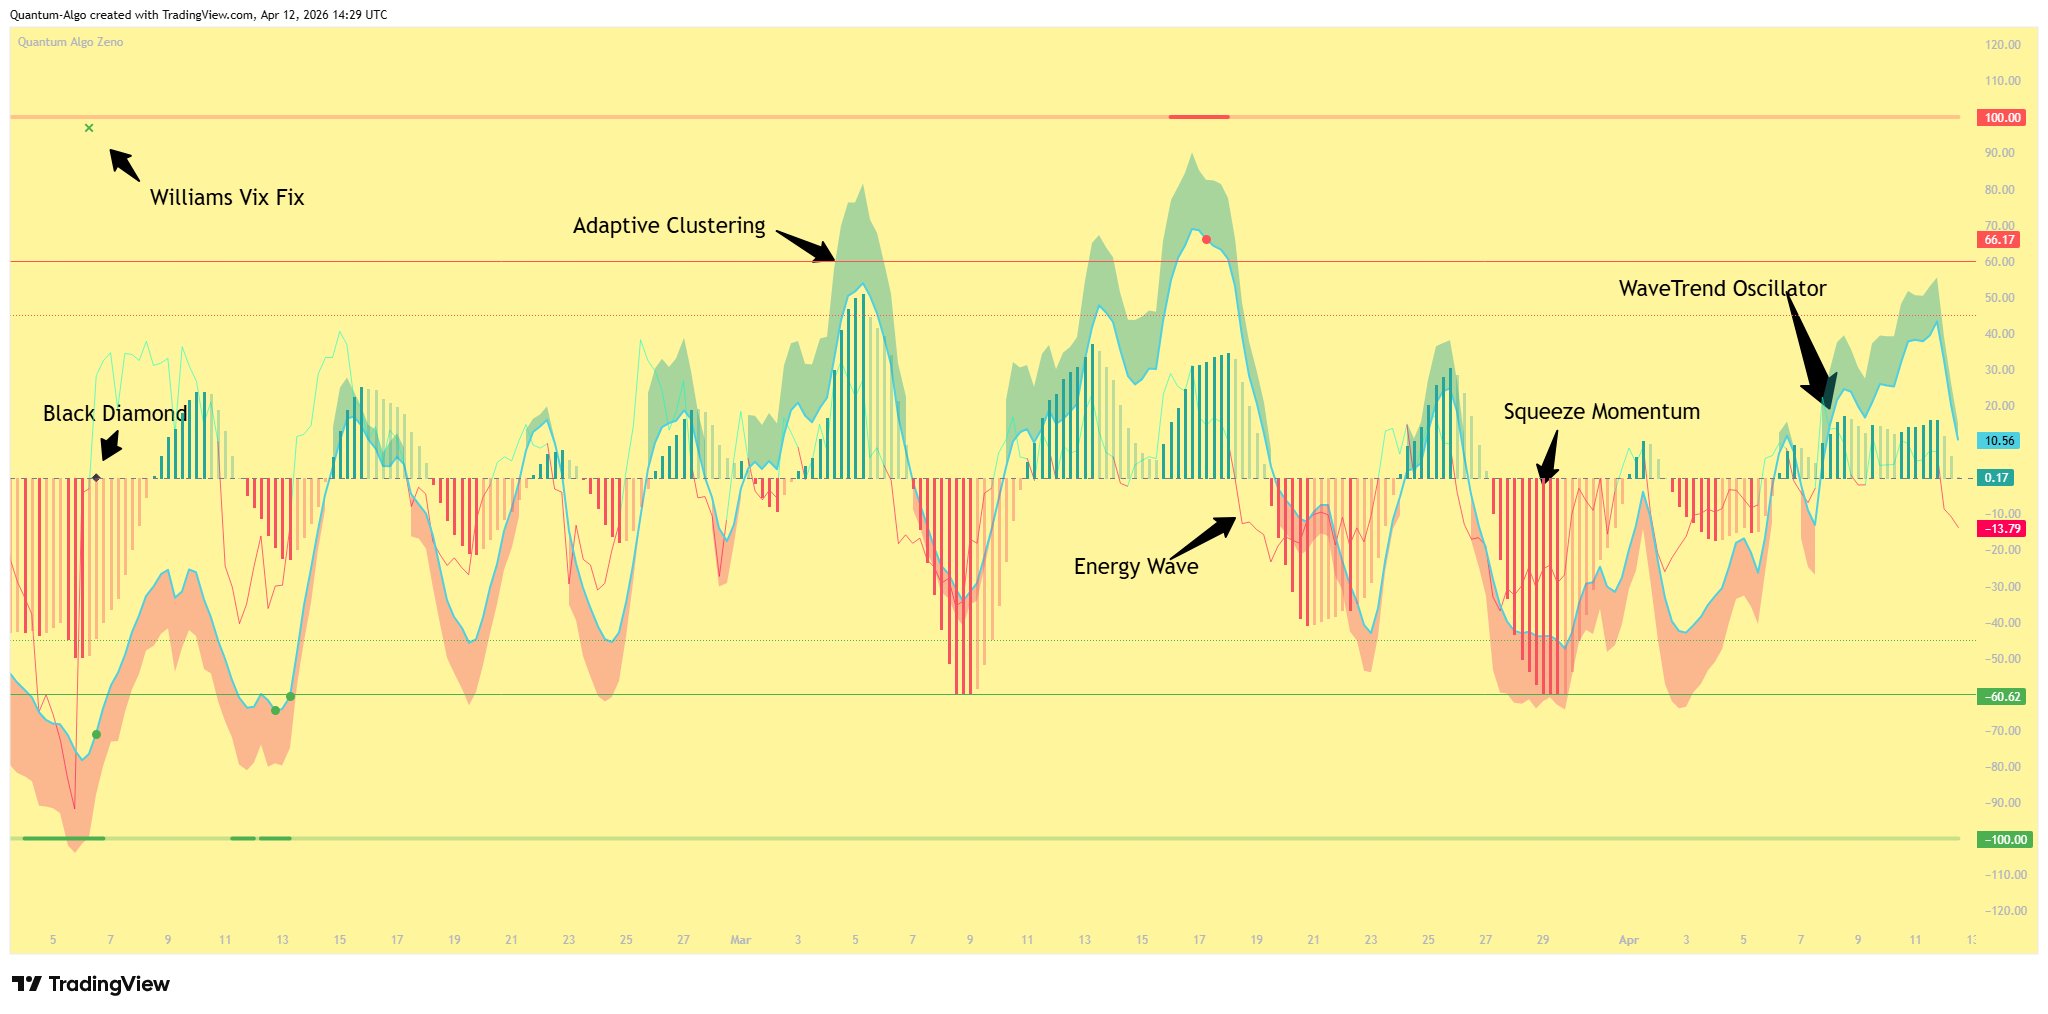
Energy Wave
A relativistic kinetic energy field that uses volume-weighted price deviation to create a smooth oscillating wave. It highlights shifts in market energy before they show up in price — think of it as an early warning system for momentum changes.
WaveTrend Oscillator
The primary momentum engine. A dual-EMA smoothed oscillator derived from HLC3, with overbought/oversold zones at +60/-60 (L1) and +45/-45 (L2). When the histogram crosses zero inside these zones, dots appear — these are your Level 1 signals.
Williams Vix Fix
Measures implied fear by tracking how far the current low deviates from the highest close. Bollinger Band and percentile thresholds detect volatility spikes that suggest reversals. WVF signals are gated by WaveTrend zones for precision.
Squeeze Momentum
Detects Bollinger Band compression within Keltner Channels — the calm before the storm. The histogram shows momentum direction and intensity. Scaled to align with WaveTrend for visual consistency.
Adaptive Clustering
A k-means clustering algorithm applied to multiple SuperTrend deviations. Groups market data into bullish, neutral, and bearish clusters to confirm whether structure supports the signal direction.
Three Tiers of Conviction
Not all signals are created equal. Zeno produces three levels of signals, each requiring more confluence than the last. Higher tier = higher conviction = larger position sizing.
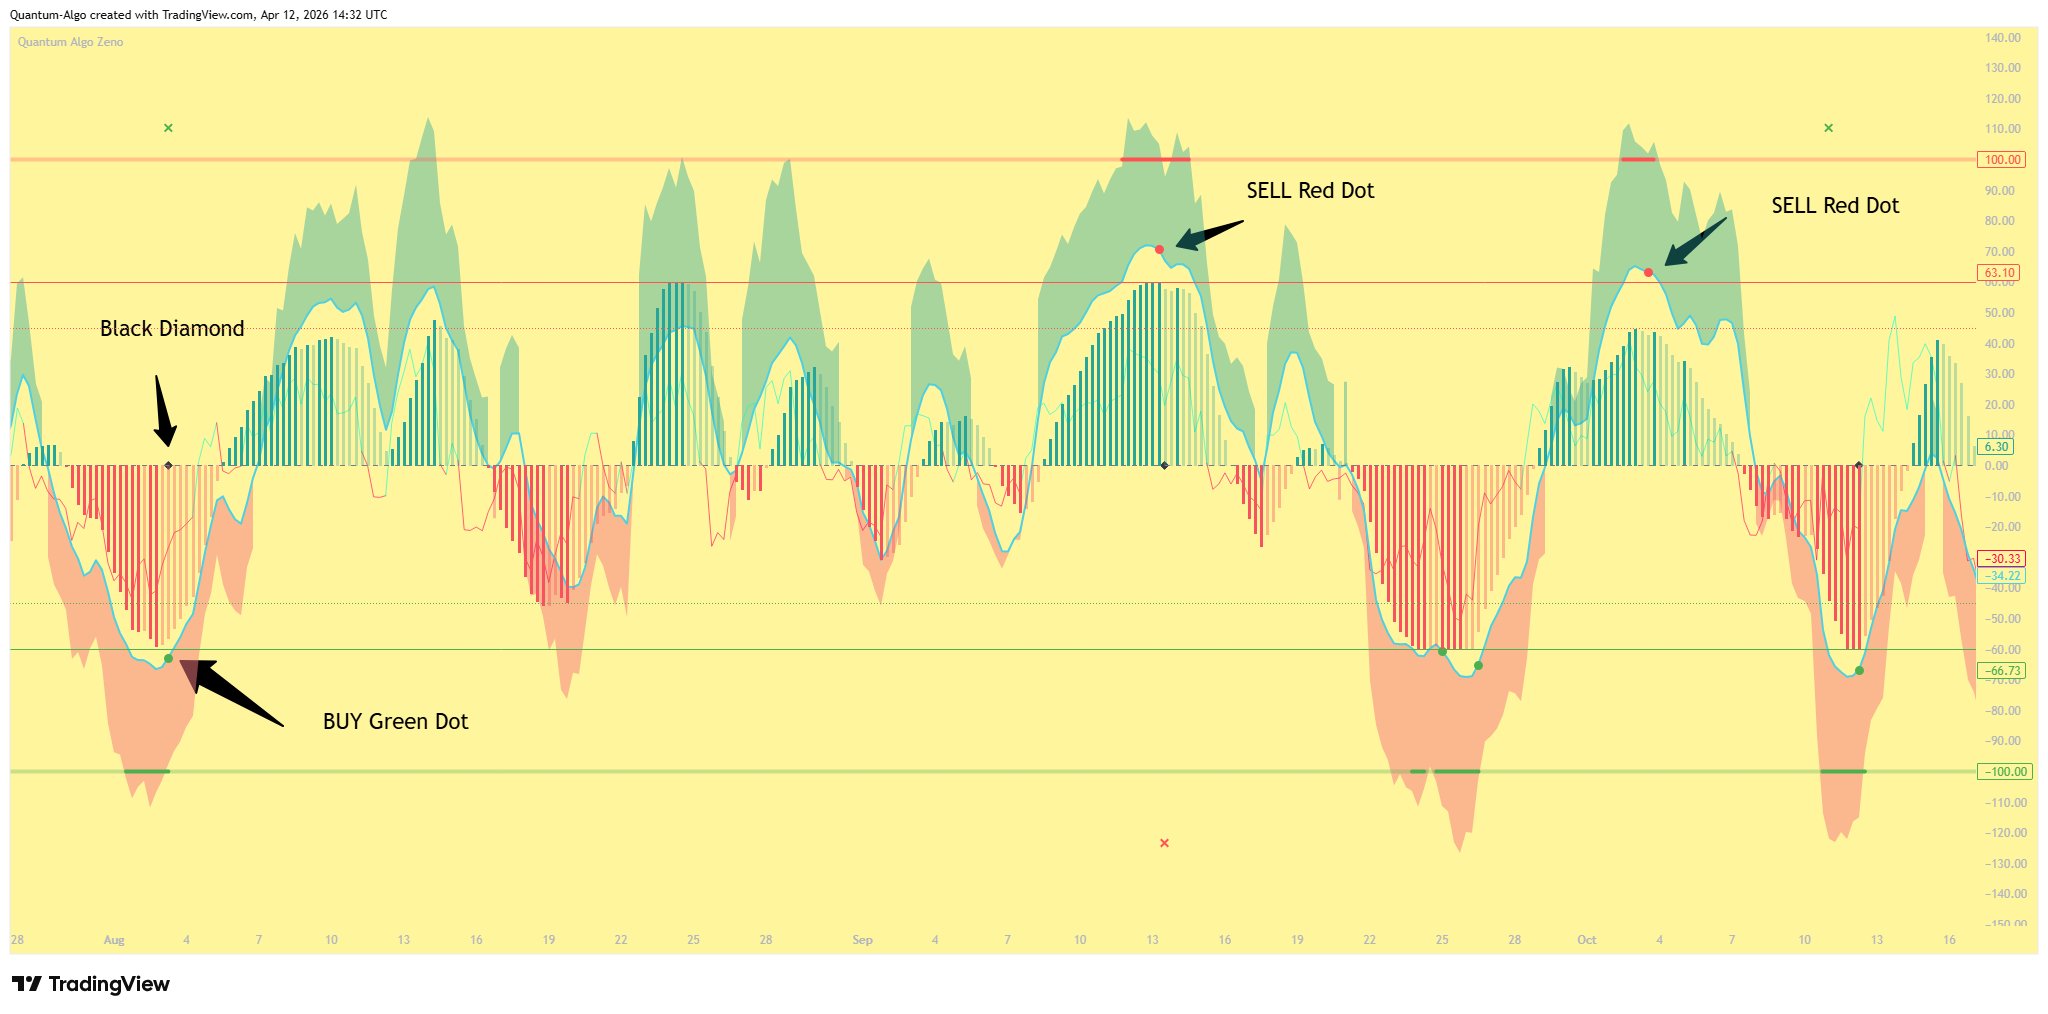
Signal (Dot)
The first indication of a potential reversal. Fires when the WaveTrend oscillator produces a histogram zero-cross while in the overbought (above +60) or oversold (below -60) zone.
What it means: Momentum has shifted direction inside an extreme zone. This is an early warning — price may reverse, but confirmation hasn't arrived yet.
How to read it: A green dot appears in the oversold zone (potential long). A red dot appears in the overbought zone (potential short).
Best used for: Alerting you to pay attention. Tighten your focus, prepare your levels, but wait for higher confirmation before committing full size.
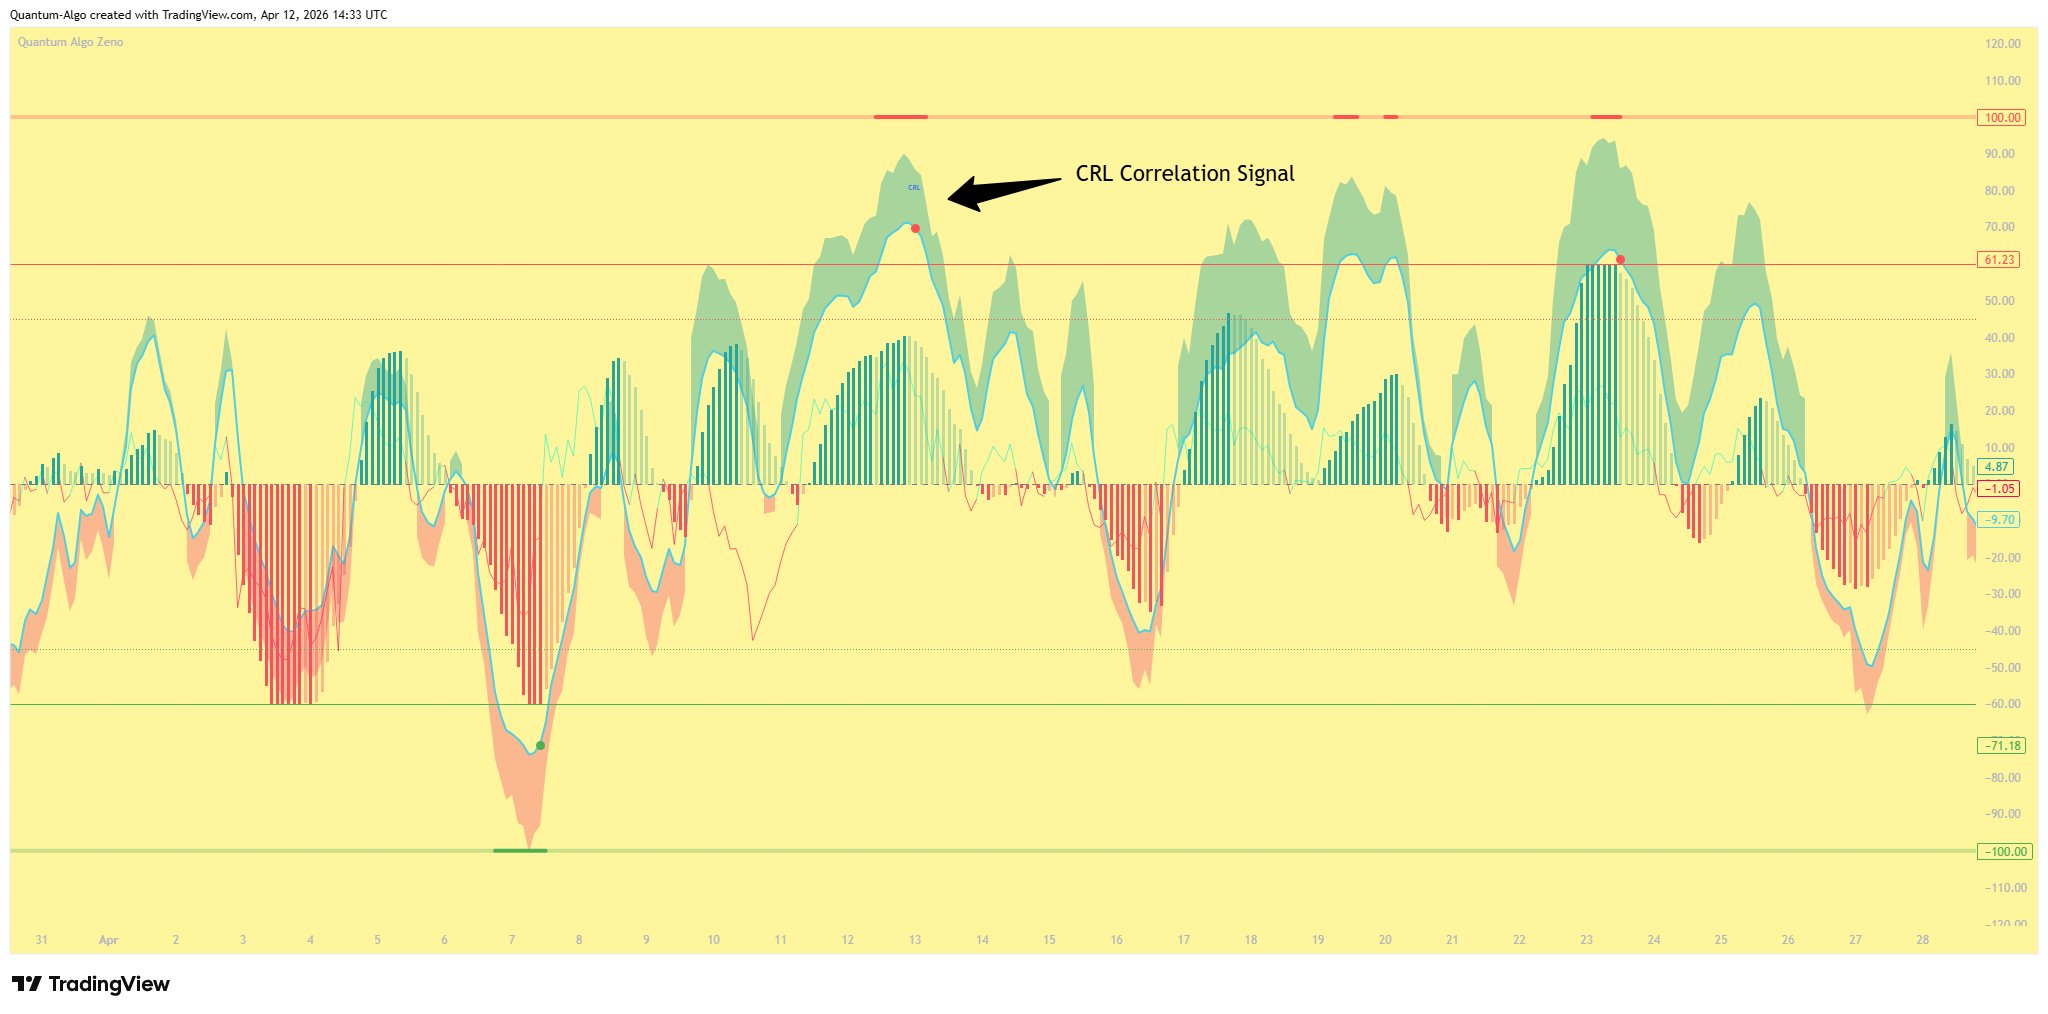
CRL Correlation Signal
Fires when the WaveTrend signal aligns across multiple timeframes simultaneously. The default configuration checks 45m, 60m, and 120m — if all selected timeframes are in the overbought or oversold zone at the same time, the CRL label appears.
What it means: This isn't just your current timeframe saying "reversal" — multiple timeframes agree. The momentum exhaustion is broad, not localized.
How to read it: A blue CRL label appears on the oscillator. The Signal Radar updates to show "CRL Signal" as the active signal type.
Best used for: Medium-conviction entries. You can size up compared to a basic Signal, but the ultimate confirmation hasn't fired yet.
Configurable timeframes: 15m, 30m, 45m, 60m, 120m, 240m — enable or disable each in the settings under "Multi-Timeframe Correlation."
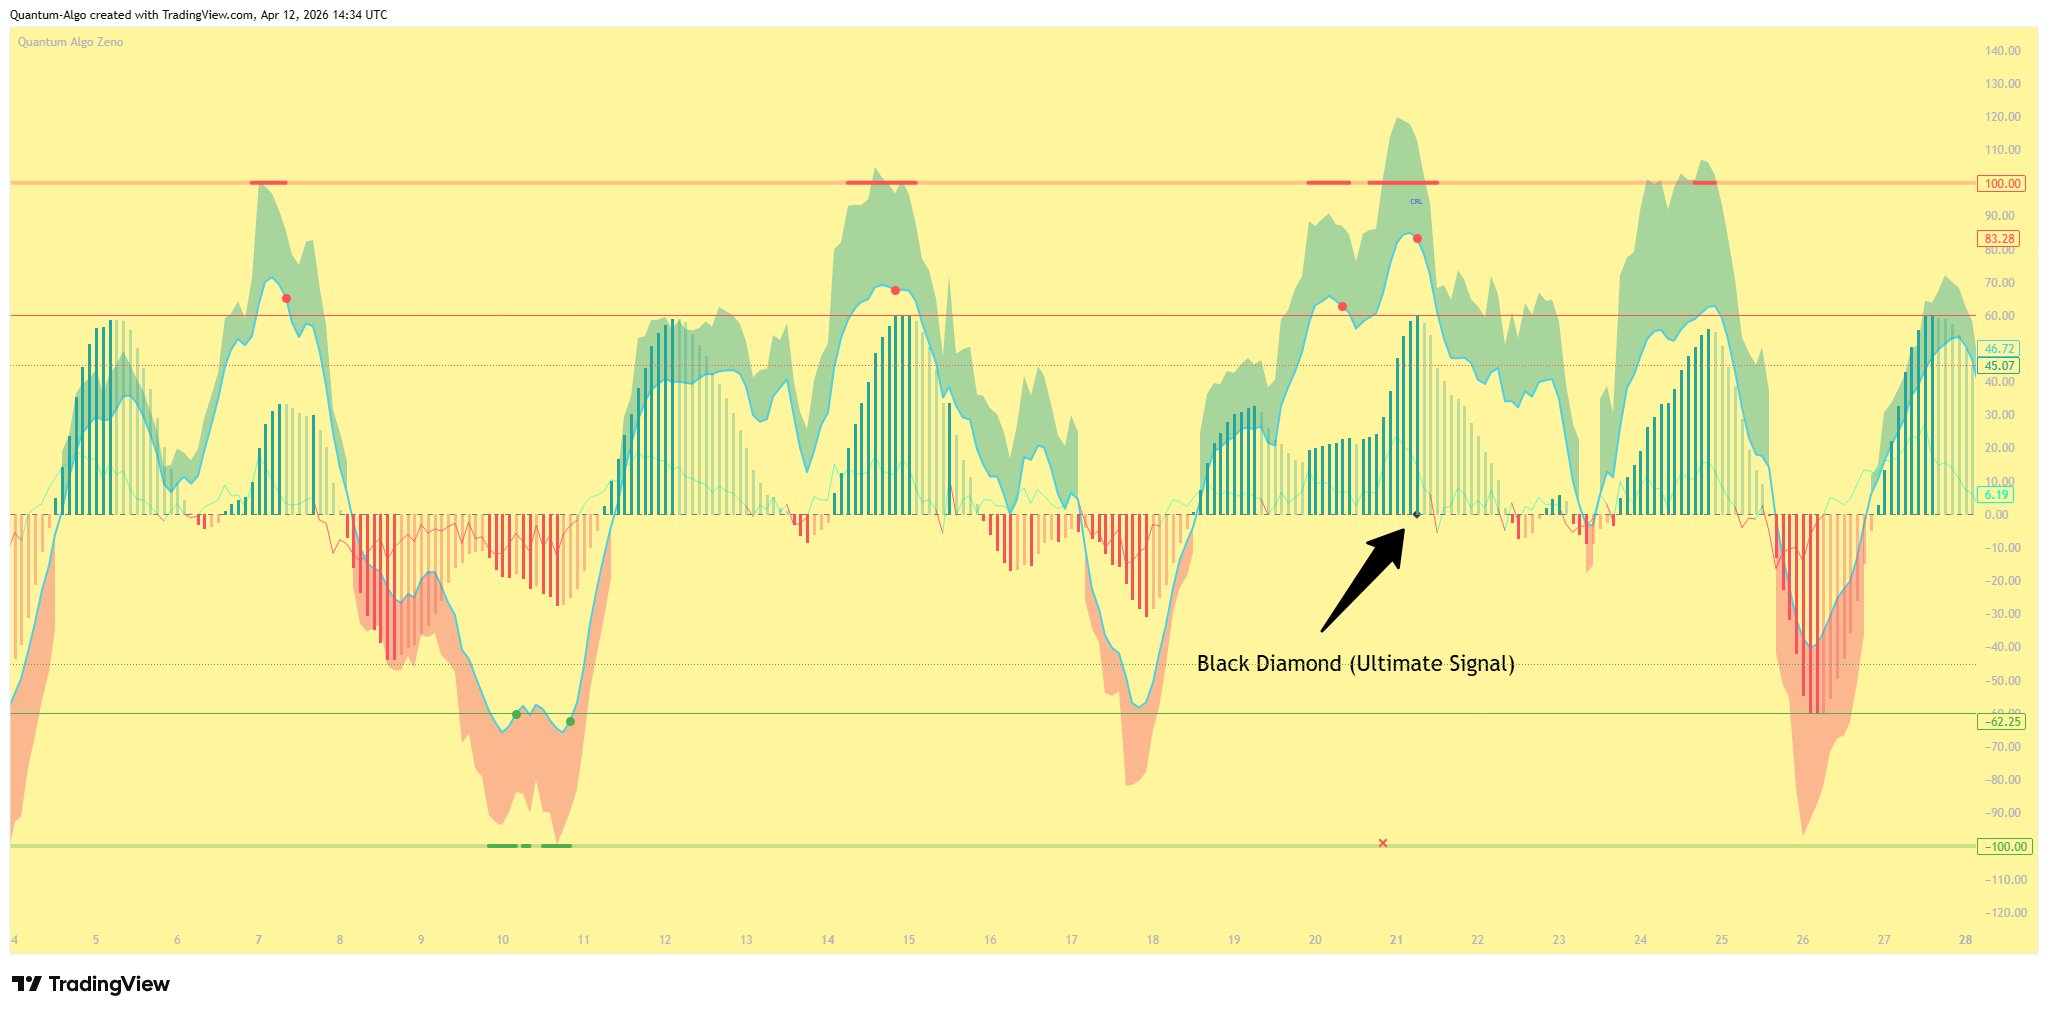
Black Diamond (Ultimate Signal)
The highest-conviction signal in Zeno. Fires when both WaveTrend and Williams Vix Fix reversal conditions have been triggered within the same overbought/oversold cycle.
What it means: Momentum exhaustion (WaveTrend) has been confirmed by a volatility spike reversal (WVF). Two independent systems agree that a reversal is underway. This is as good as it gets.
How to read it: A black diamond shape appears at the zero line of the oscillator. The Signal Radar dashboard highlights "Black Diamond" as the active signal.
Best used for: Full-conviction entries. This is your A+ setup. Size accordingly.
How it works under the hood: The indicator maintains a memory system — it tracks whether a WaveTrend dot has fired AND whether a WVF reversal has fired during the current OB/OS cycle. When both have occurred (in any order), the Black Diamond triggers. The memory resets when price exits the OB/OS zone.
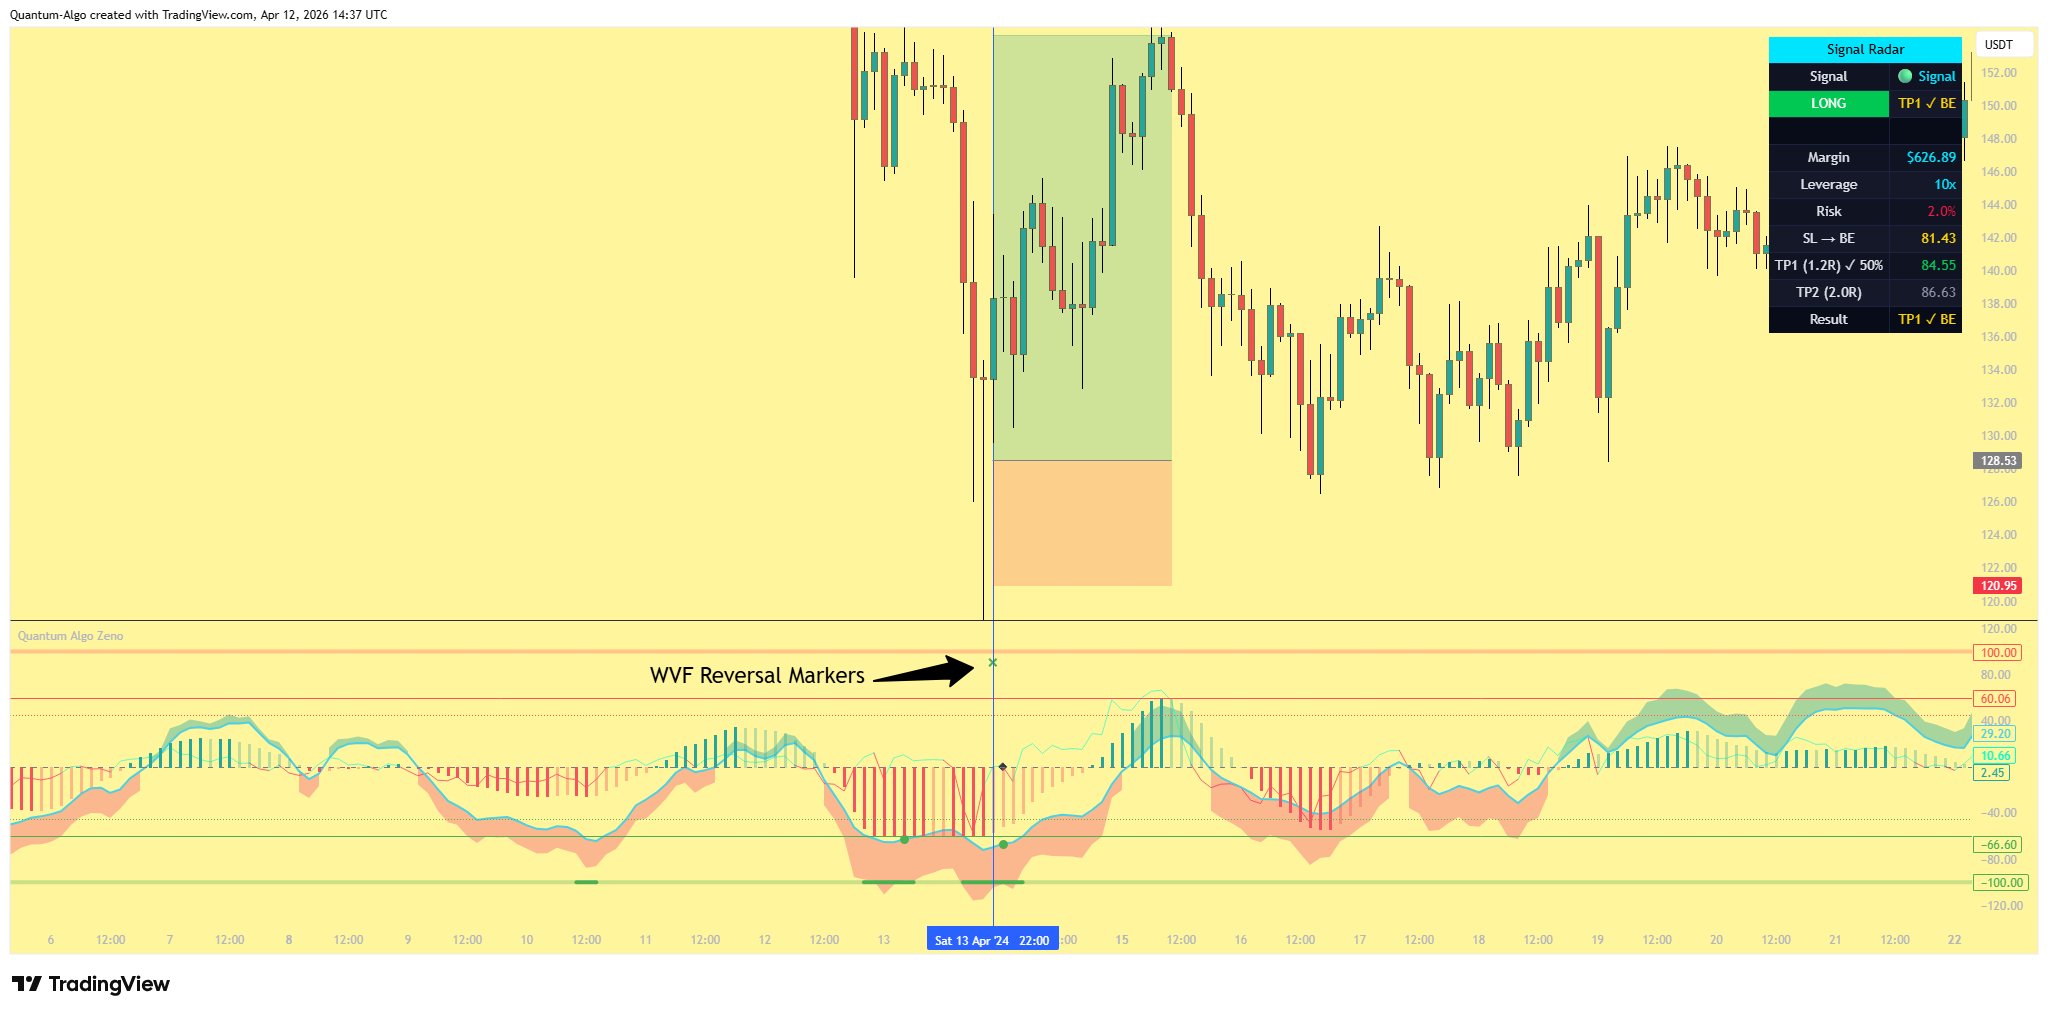
WVF Reversal Markers
In addition to the three main signal tiers, Zeno displays WVF Bearish and Bullish Reversal markers — small X crosses that appear at the top (bearish) or bottom (bullish) of the oscillator pane.
These are not standalone trade signals. They indicate that the Williams Vix Fix has detected a volatility reversal condition while price is in a WaveTrend extreme zone. They contribute to the Black Diamond signal when combined with a WaveTrend dot.
Green X at top = Bearish WVF reversal detected (potential short setup building).
Red X at bottom = Bullish WVF reversal detected (potential long setup building).
Energy Wave
The Energy Wave is a continuous line that oscillates above and below the zero line. It changes color based on direction — green when positive (bullish energy), red when negative (bearish energy).
How to use it: The Energy Wave often crosses zero before the WaveTrend signals fire. Use it as an early warning — when the wave starts turning while WaveTrend is in an extreme zone, a signal is likely incoming.
It's also useful for divergence — if price makes a new high but the Energy Wave makes a lower high, momentum is fading.
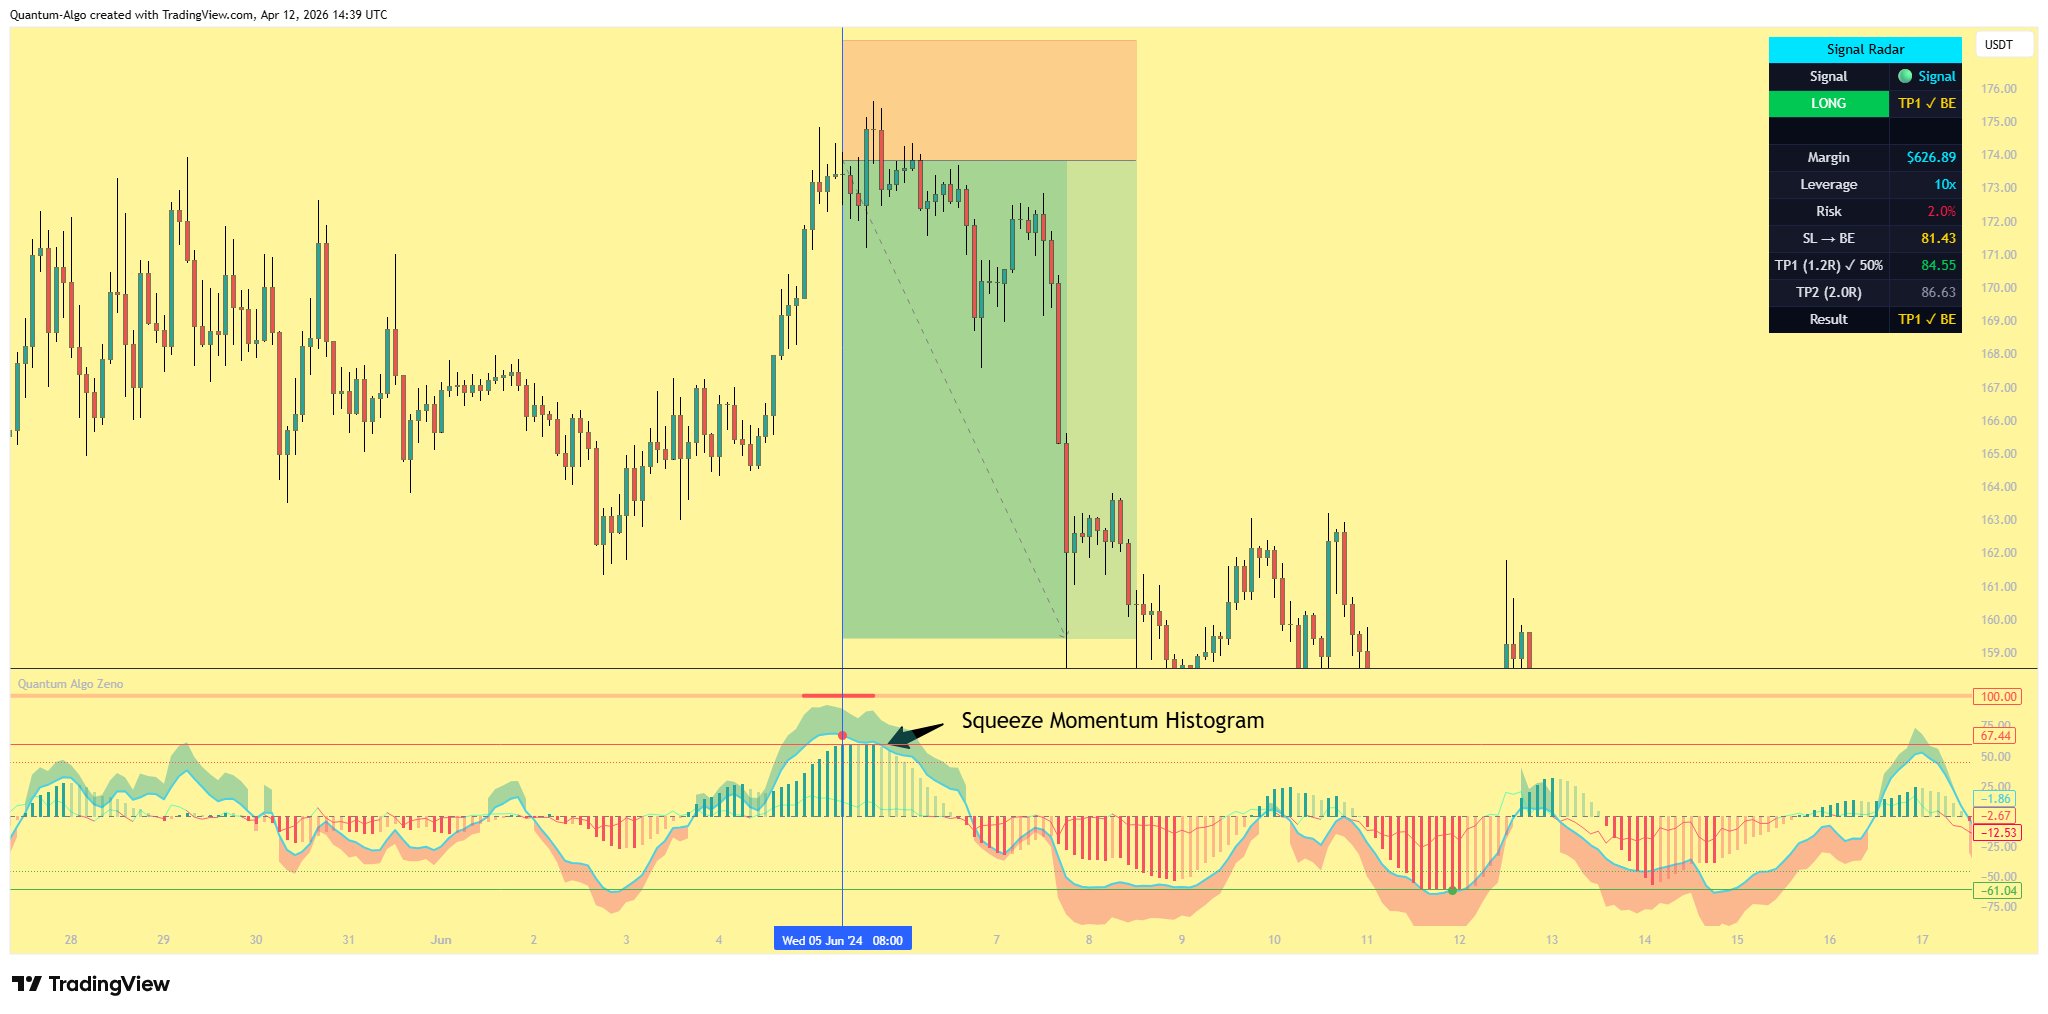
Squeeze Momentum Histogram
The histogram bars at the bottom of the oscillator show squeeze momentum — the directional force of the current move.
Four colors tell the story:
Strong green = Momentum accelerating upward (bullish, getting stronger).
Fading green = Momentum still positive but decelerating (bullish, losing steam).
Strong red = Momentum accelerating downward (bearish, getting stronger).
Fading red = Momentum still negative but decelerating (bearish, losing steam).
Best used for: Confirming signal direction. A Signal or CRL firing while squeeze momentum bars are strong in the same direction adds confidence. Fading bars suggest the move may be running out of fuel.
The Dashboard
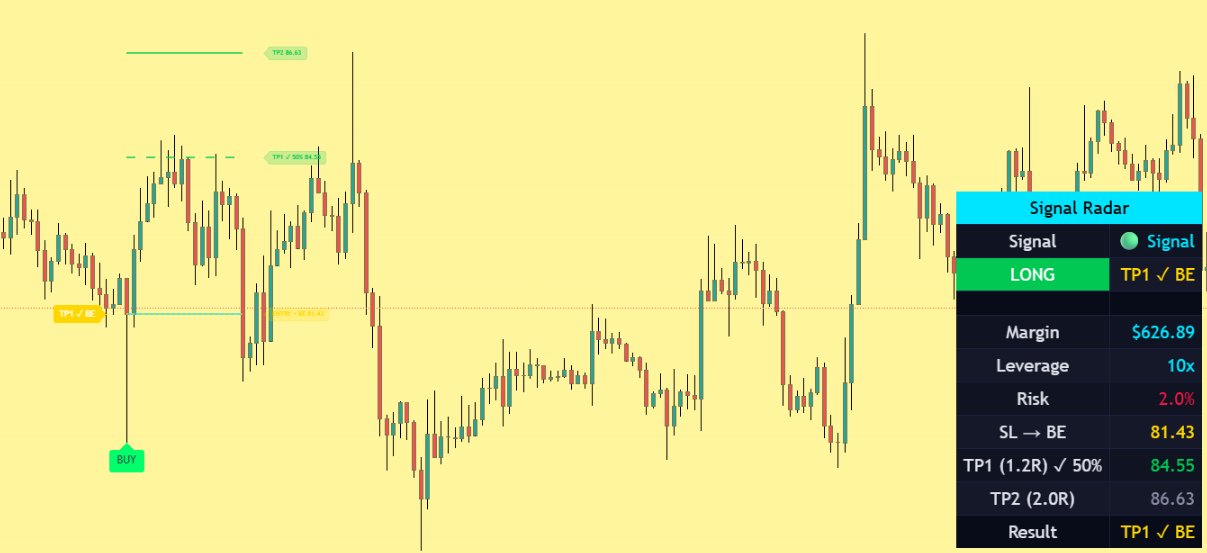
When a signal fires, the Signal Radar dashboard appears on your price chart (top right by default). It's a real-time command center that shows you everything about the current trade.
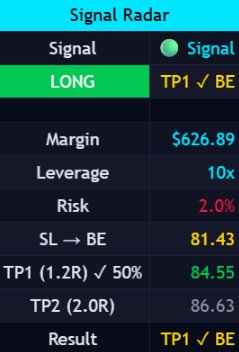
Dashboard Rows
| Row | What It Shows |
|---|---|
| Signal | Which signal fired — Signal, CRL Signal, or Black Diamond — with its icon |
| Direction | LONG (green) or SHORT (red) + trade result status |
| Margin | Exact dollar amount of collateral needed for this trade |
| Leverage | Your configured leverage (default 10x) |
| Risk | Percentage of capital at risk (default 2%) |
| Stop Loss | Price level — changes to "SL → BE" when breakeven is active |
| TP1 | Price level with R:R ratio — shows "✓ 50%" when hit |
| TP2 | Price level with R:R ratio — shows "✓ EXIT" when hit |
| Result | Final outcome: TP1 ✓ 50%, TP2 ✓ EXIT, TP1 ✓ BE, or SL ✗ |
Built-In Trade Management
Zeno doesn't just give you entry signals — it manages the entire trade lifecycle with ATR-based stop-loss and take-profit levels, automatic breakeven logic, and real-time outcome tracking.
Default Risk Parameters
| Parameter | Default | Purpose |
|---|---|---|
| Capital | $10,000 | Your account balance |
| Leverage | 10x | Position multiplier |
| Risk Per Trade | 2% | Max loss per trade ($200 on $10k) |
| Stop Loss | 2.5x ATR | Distance from entry to stop |
| TP1 | 3.0x ATR (1.2R) | First target — 50% close |
| TP2 | 5.0x ATR (2.0R) | Final target — full exit |
Trade Lifecycle
Signal Fires
Entry price is locked. SL, TP1, and TP2 lines are drawn on the price chart. A BUY or SELL label appears at the signal bar. Position size and margin are calculated based on your risk settings.
TP1 Hit — 50% Close, SL to Breakeven
When price reaches TP1, the indicator assumes you close 50% of your position and lock in profit. The stop-loss automatically moves to your entry price (breakeven). The SL line turns gold and the label updates to "Entry + Breakeven." You are now risk-free on the remaining 50%.
TP2 Hit — Full Exit
When price reaches TP2, the remaining 50% is closed. All lines stop extending at the TP2 bar. The result shows TP2 ✓ EXIT.
SL Hit Before TP1 — Full Loss
If price hits the stop-loss before reaching TP1, the full position is closed at a loss. Lines stop at the SL bar. The result shows SL ✗.
SL Hit After TP1 — Breakeven Exit
If TP1 was hit (50% closed with profit) and then price reverses back to entry, the remaining 50% exits at breakeven. The result shows TP1 ✓ BE. You still keep the profit from the first 50%.
The margin shown in the Signal Radar is calculated as: Risk Amount ÷ SL Distance × Entry Price ÷ Leverage. This ensures that if your stop-loss is hit, you lose exactly your configured risk percentage — no more. The leverage cap prevents positions from exceeding your maximum margin.
What You See on the Price Chart
Even though Zeno is an oscillator (separate pane), it draws trade management visuals directly on your price chart using force overlay.
Lines
Entry line (cyan solid) — Marks the price where the trade was entered.
SL line (red dashed) — Stop-loss level. Disappears when SL moves to breakeven.
TP1 line (green dashed) — First take-profit target.
TP2 line (green solid) — Final take-profit target.
BE line (gold dotted) — Appears at entry price when TP1 is hit and SL moves to breakeven.
Labels
BUY / SELL — Large label at the signal bar on the price chart.
Entry + Breakeven — Combined label when SL moves to entry (prevents overlap).
Result label — Appears on the left side of the trade showing the final outcome.
Line Behavior
Lines extend forward as the trade progresses. When a trade closes (SL or TP2 hit), all lines stop at the bar where the exit occurred — they don't keep extending to the right edge of the chart.
Step-by-Step Strategy
Add Zeno to Your Chart
The oscillator appears in a separate pane below your price chart. The Signal Radar dashboard automatically appears on the price chart when signals fire.
Set Your Risk Parameters
Open settings and configure your Capital, Leverage, and Risk % under "Risk Management." These determine your position size and margin for every trade.
Watch the Energy Wave
Before signals fire, the Energy Wave often gives an early warning by crossing zero or showing divergence. Use this to mentally prepare — a signal may be incoming.
Wait for Signal Dots
Green/red dots at the L1 zones are your Level 1 signals. Check the squeeze momentum histogram — strong bars in the same direction add confidence.
Scale With Conviction
A basic Signal is a heads-up. A CRL Signal means multiple timeframes agree. A Black Diamond means momentum + volatility are both confirming. Size your position accordingly.
Manage the Trade
Let the built-in risk management handle the lifecycle. Close 50% at TP1, let the rest ride to TP2 risk-free. The Signal Radar dashboard shows you everything in real-time.
Use the multi-timeframe filter on lower timeframes (5m, 15m) to filter noise. On higher timeframes (1H, 4H), consider disabling it or reducing the number of correlated timeframes. The squeeze momentum histogram provides critical context — strong momentum bars in the direction of the signal significantly increase confidence.
Understanding the Levels
| Level | Value | Meaning |
|---|---|---|
| OB L0 | +110 | Extreme overbought — maximum exhaustion |
| OB L1 | +60 | Overbought zone — signals can fire here (red dots) |
| OB L2 | +45 | Mild overbought — L2 dots (hidden by default) |
| Zero Line | 0 | Neutral — momentum equilibrium |
| OS L2 | -45 | Mild oversold — L2 dots (hidden by default) |
| OS L1 | -60 | Oversold zone — signals can fire here (green dots) |
| OS L0 | -110 | Extreme oversold — maximum exhaustion |
Key Settings
Zeno is highly configurable. Here are the most important settings and when to adjust them.
Channel & Average Length
Default 10/21. Lower values = more responsive but noisier. Higher values = smoother but slower. The defaults work well on 5m–4H timeframes.
Multi-Timeframe Correlation
Default: 45m, 60m, 120m enabled. On lower timeframes, this filters out noise significantly. On 4H+, consider disabling it to avoid missing signals.
AI Confirmation
Enabled by default with 0.15 confidence threshold. This uses k-means clustering to confirm signal direction. Higher threshold = fewer but higher-quality signals.
Dashboard Position & Size
Configurable position (top right, top left, etc.) and size (tiny, small, normal, large). The dashboard can be hidden entirely if you only want the oscillator signals.