Zeno | Gravity Zone
Zeno Gravity Zone indicator complete guide. Configuration, entry/exit logic, and how Gravity Zones detect institutional accumulation on TradingView.
Institutional-grade gravity zone with smart optimized entries, multi-factor confluence scoring, and full trade management on the price chart.
What Is Gravity Zone?
Gravity Zone is a price chart overlay indicator built around an institutional gravity level. It identifies high-probability trade setups where price interacts with this key structural level — the "gravity zone" that institutions use as a reference point.
Unlike simple crossover strategies, Gravity Zone uses a multi-factor confluence scoring system to filter entries, then applies a smart optimized entry to enter at a better price — not where most retail traders enter, but where smart money tends to accumulate.
Backtesting has proven the 2-hour timeframe delivers the best results with this strategy. Every trade includes automatic risk management — volatility-based stop-loss, dual take-profit targets, 50% position close at TP1 with stop-loss moving to breakeven, and full exit at TP2. All visualized directly on your chart.
How Gravity Zone Works
The strategy follows a precise sequence. Every trade goes through these four stages before an entry is placed.
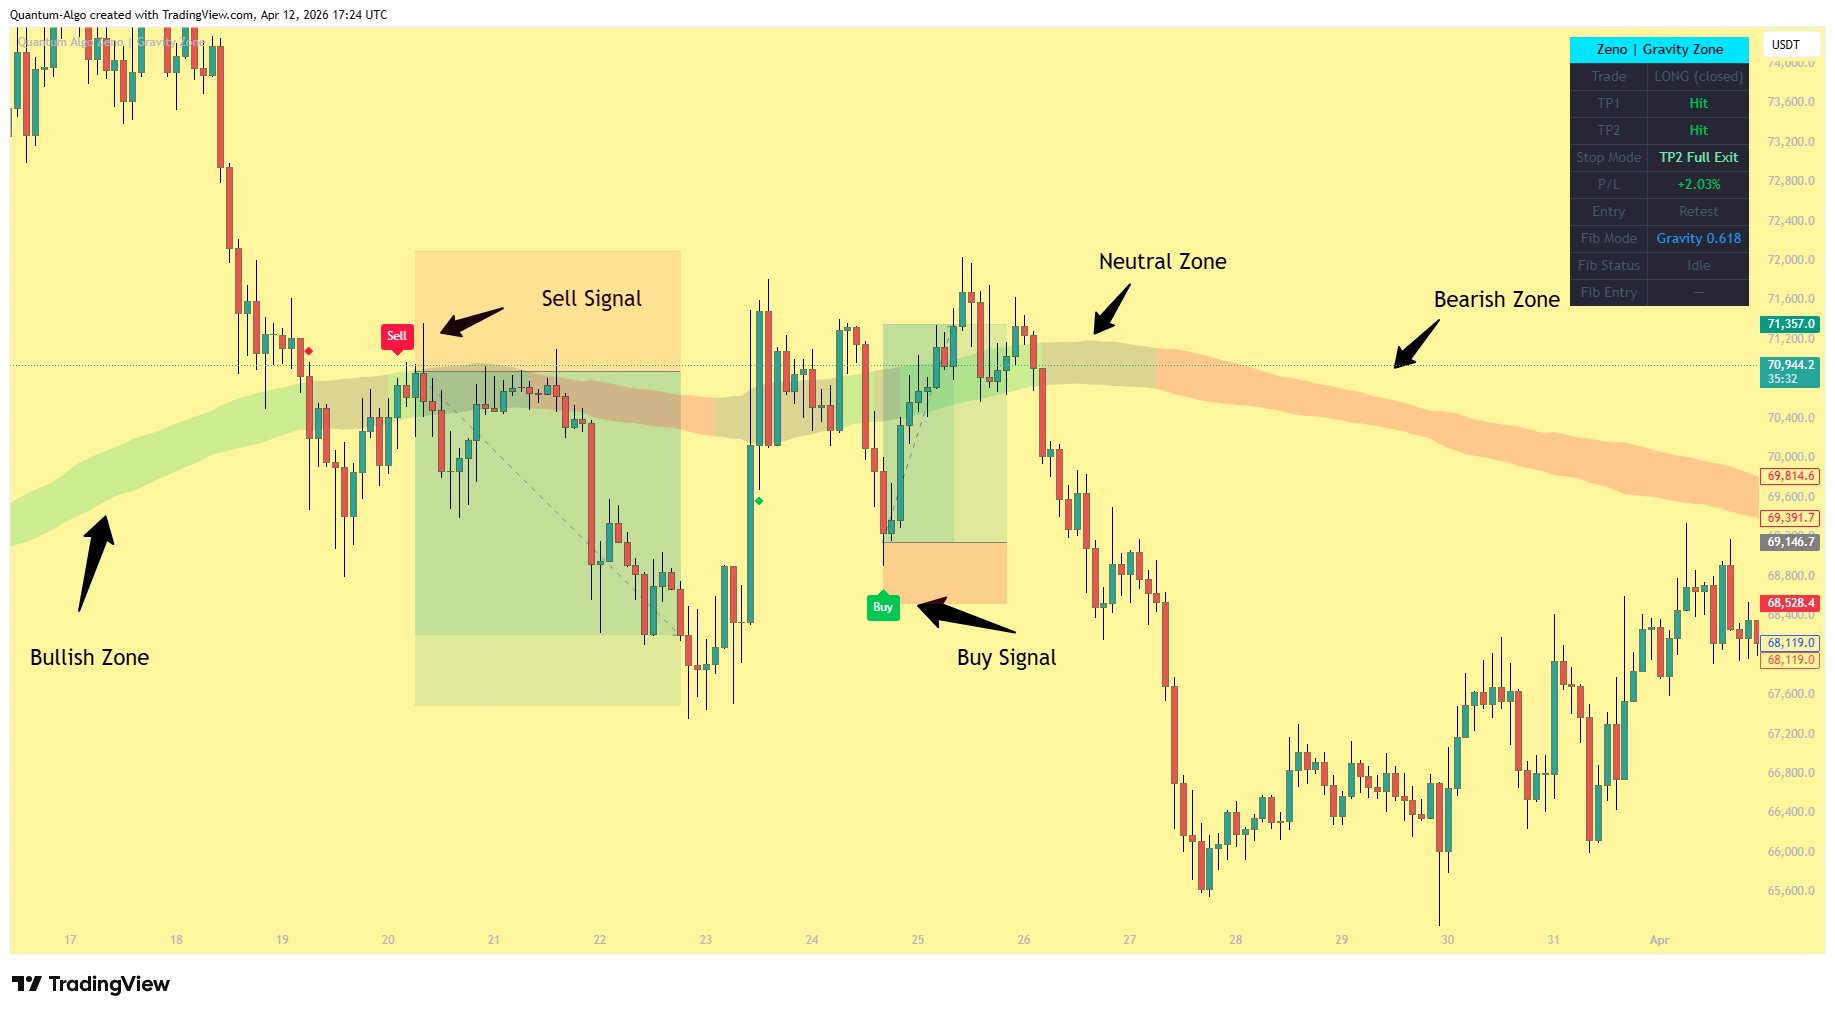
Price Approaches the Gravity Zone
The gravity level acts as an institutional magnet. The indicator defines a dynamic volatility-adjusted zone around it — a band that expands and contracts with market conditions. Price must touch or enter this zone to begin the sequence.
The zone changes color based on the underlying structure: green when rising (bullish structure), red when falling (bearish structure), gray when flat. You control the zone width and opacity in settings.
Confluence Scoring
When price interacts with the zone, the indicator runs a multi-factor confluence check. Multiple independent conditions must confirm before a signal is considered valid.
The confluence system evaluates:
1. Zone Interaction — Price has recently touched or crossed the zone.
2. Reaction Quality — A decisive bullish or bearish candle shows rejection from the zone.
3. Volume Confirmation — Participation is elevated above recent averages.
4. Momentum Position — Price is not already overextended.
5. Trend Alignment — The underlying trend is aligned with the trade direction.
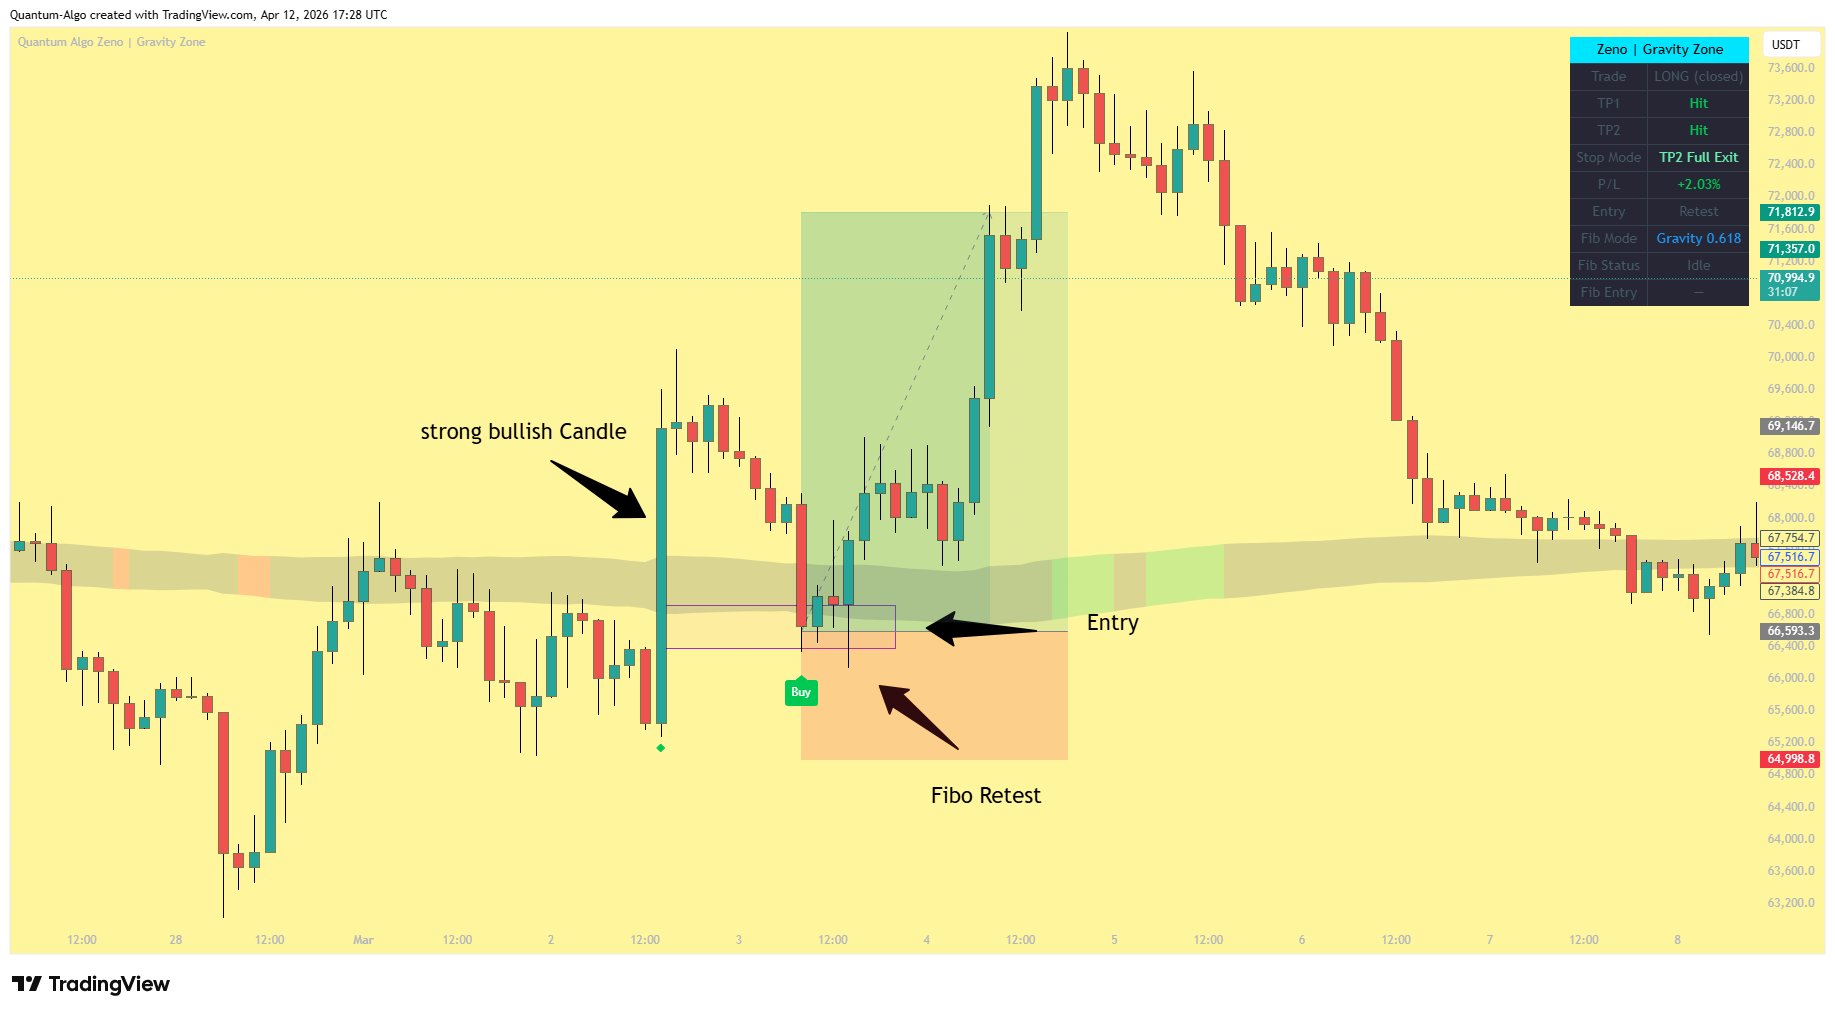
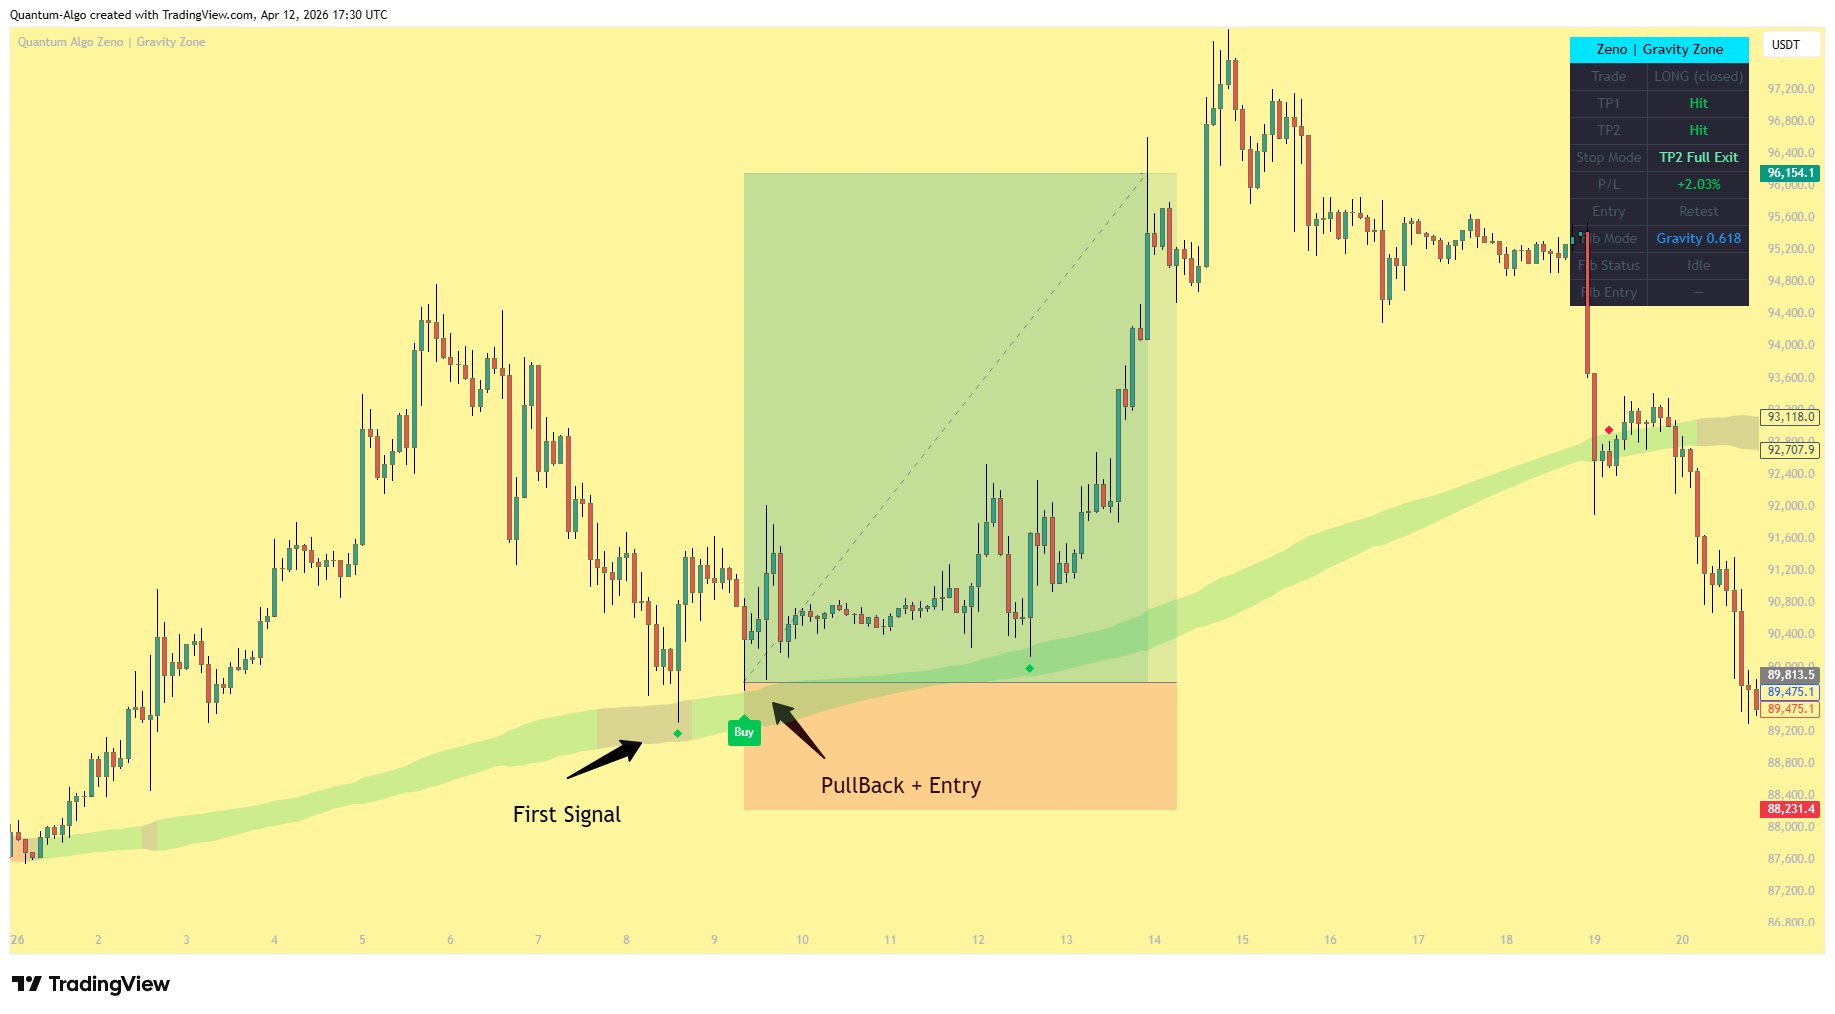
Pullback Retest (Entry Mode)
The default entry mode is Pullback Retest — the indicator doesn't enter on the first touch. Instead, it watches for price to move away from the zone and then come back to retest it within a configurable window.
This filters out false breakouts and ensures you're entering on a confirmed reaction, not a random wick.
Alternative: First Touch mode enters immediately on confluence — faster but less filtered.
Smart Optimized Entry
This is what makes Gravity Zone unique. When confluence fires, instead of entering at the close, the indicator analyzes the recent swing structure and places a pending entry at an optimal price level where institutional reaccumulation typically happens.
Price must retrace to this level within the expiry window for the trade to fill. If it doesn't reach the level or if price invalidates the structure, the setup expires — no entry, no loss.
This gives you a significantly better entry price than entering at the close, with tighter risk and better reward-to-risk ratios.
The Optimized Entry Advantage
The Smart Optimized Entry is the core differentiator of this indicator. Here's how it works and why it matters.
How the Entry Zone Is Drawn
When confluence fires, the indicator looks back across the recent price action to identify the swing low (for longs) or swing high (for shorts). It then calculates the optimal pullback area between that swing point and the signal candle.
The pending entry is placed within this area. The zone appears as a cyan box on the chart — this is where you want price to retrace to.
Why This Entry Wins
The optimized entry targets the zone where institutional reaccumulation typically happens. After an initial move, smart money lets price retrace before adding to their position. By entering here instead of chasing the initial move, you get:
Better entry price — You're buying the dip, not the push.
Tighter stop-loss — Your invalidation is closer because you're near structure.
Higher R:R — Same targets but from a better price = more reward per unit of risk.
When the indicator finds a valid setup, it calculates the optimal entry level from the surrounding swing structure. The trade only fires when price reaches that level — meaning you never chase, and every entry has better geometry than the signal candle close.
Entry Settings
| Setting | What It Controls |
|---|---|
| Entry Level | Where the pending entry is placed within the structure |
| Swing Lookback | How far back to look for the reference swing |
| Entry Expiry | How long to wait for price to reach the entry level |
| SL Buffer | Extra padding below swing for SL placement |
| Drawing Style | Full, Zone Only, or Minimal (just the box) |
Trade Management System
Every trade in Gravity Zone is fully managed from entry to exit. Lines, labels, and the dashboard update in real-time as the trade progresses.
Risk Parameters
| Parameter | Type | Configurable |
|---|---|---|
| Stop Loss | Volatility-based | Adjustable multiplier |
| Take Profit 1 | Volatility-based | Adjustable multiplier |
| Take Profit 2 | Volatility-based | Adjustable multiplier |
| Risk Per Trade | % of account | User-defined |
| Account Size | Dollar value | User-defined |
The default stop-loss gives the optimized entry room to breathe. Since you're entering on a pullback rather than at the close, the stop needs enough cushion to let the setup complete without getting clipped by noise. The defaults have been tuned through extensive backtesting on the 2H timeframe to keep the R:R ratio profitable across hundreds of trades.
Trade Lifecycle
Confluence Fires
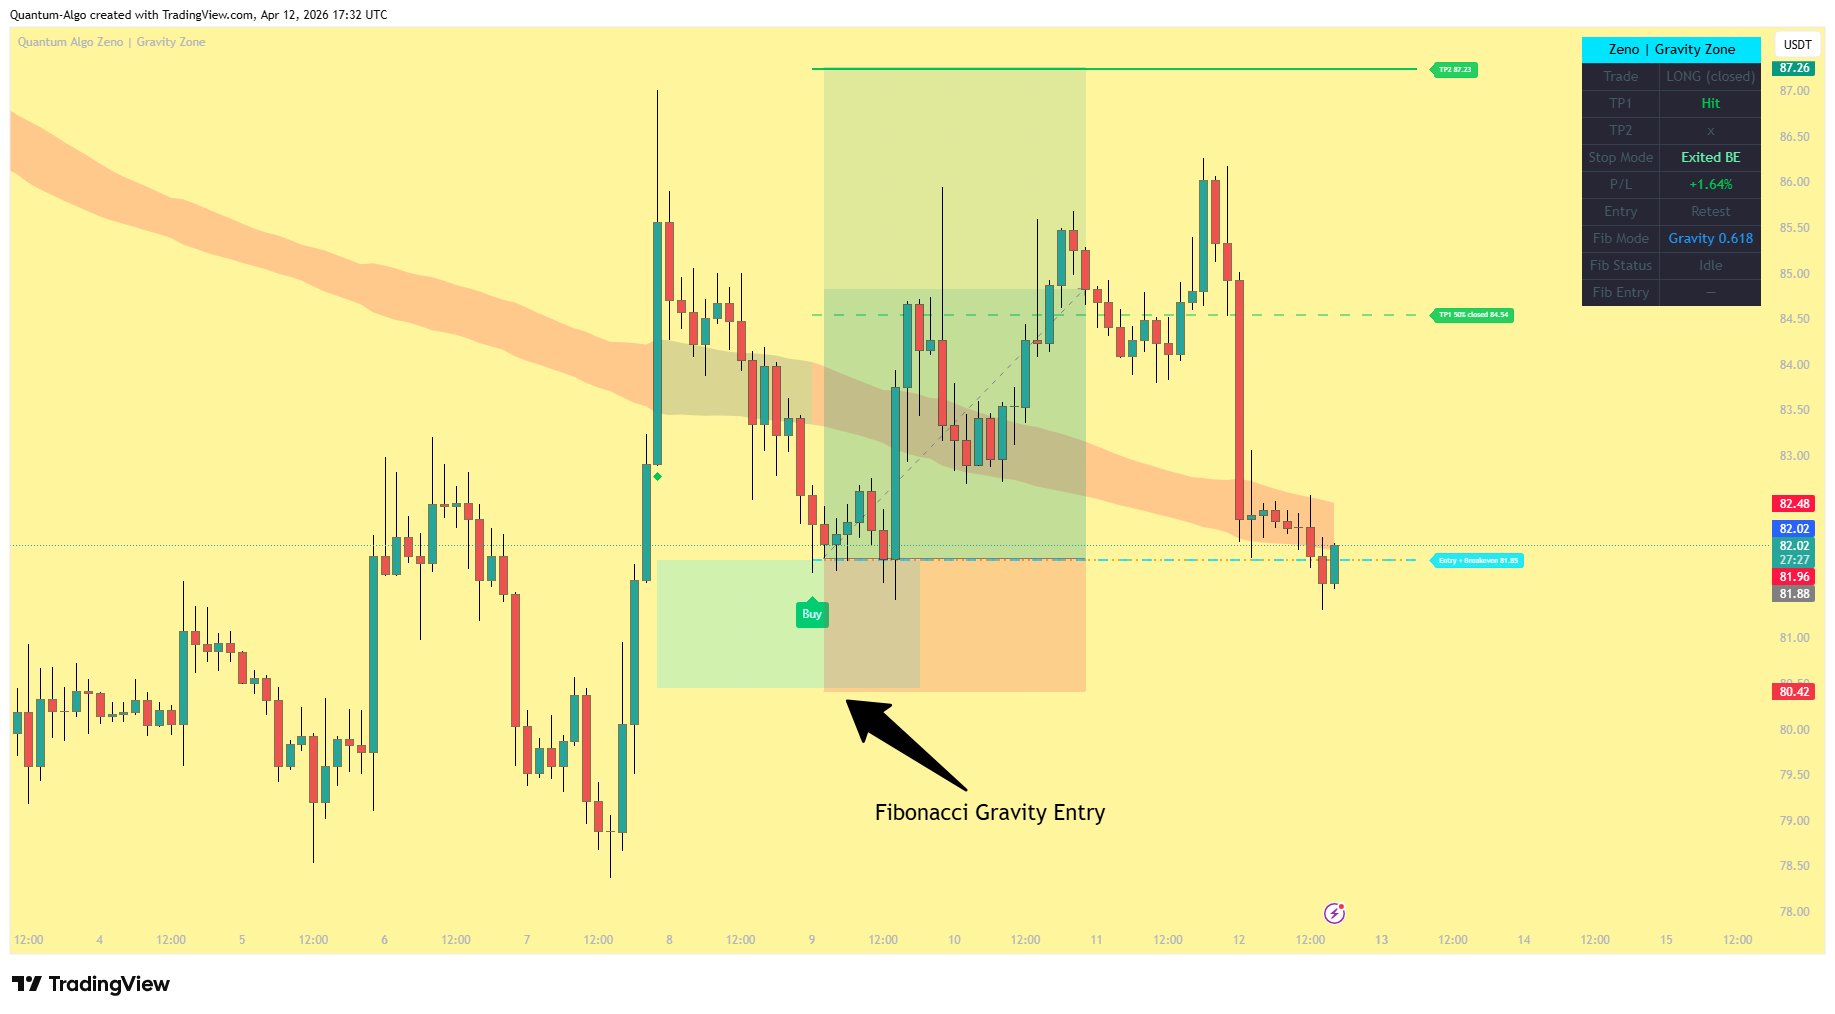
A green diamond (long) or red diamond (short) appears on the chart. The entry zone is drawn. The indicator waits for price to retrace to the optimized entry level.
Entry Filled
Price reaches the optimized entry level. A Buy or Sell label appears. Entry, SL, TP1, and TP2 lines are drawn on the chart. The entry zone stays visible so you can see where you entered relative to structure.
TP1 Hit — 50% Close, SL to Breakeven
When price reaches TP1, the indicator closes 50% of the position. The stop-loss moves to entry price (breakeven). The red SL line disappears and is replaced by a cyan dashed breakeven line at entry. The label changes to "Entry + Breakeven". You are now risk-free on the remaining 50%.
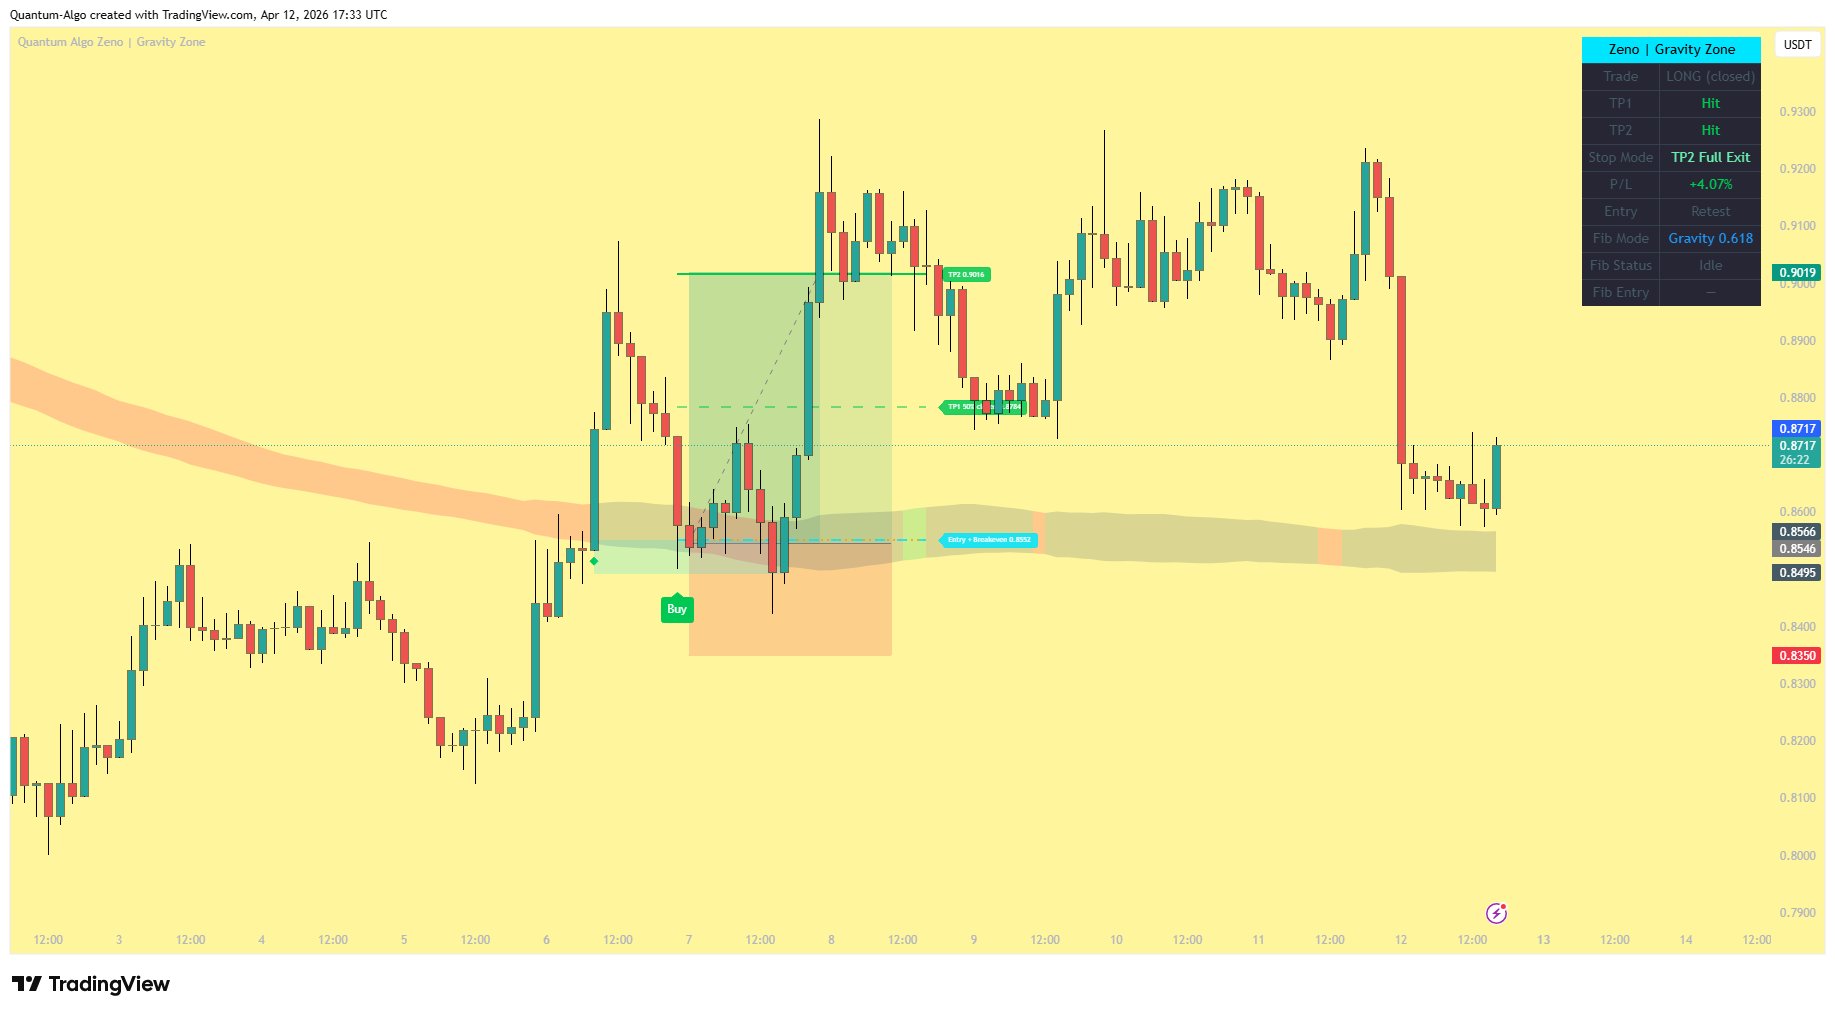
TP2 Hit — Full Exit
The remaining 50% closes at TP2. The dashboard shows the combined P/L from both halves.
SL Hit Before TP1
Full position closes at a loss. The dashboard shows the loss percentage.
SL Hit After TP1 (Breakeven)
The remaining 50% exits at entry price (0% loss). You keep the profit from the first 50% that closed at TP1. The dashboard shows the net result.
Configure Your Capital, Risk, and Leverage
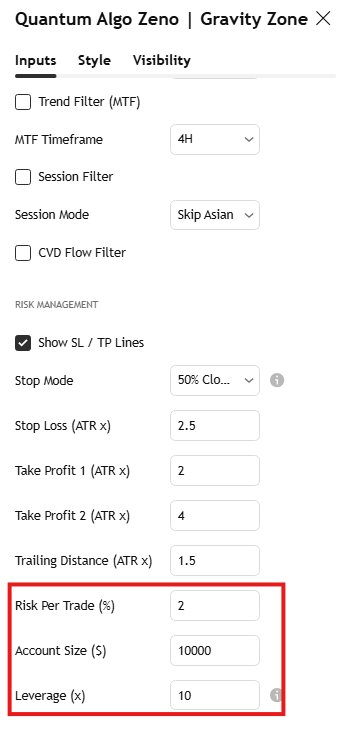
Gravity Zone sizes every trade automatically based on three settings you control. Open the indicator settings, scroll to the Risk Management group, and configure these three fields. The dashboard will then show you the exact margin required for every trade.
Account Size ($)
Enter the total capital you're trading with on this account. Default is $10,000. If you have $5,000 on Bybit, enter 5000. This value is used to calculate how much you risk per trade.
Risk Per Trade (%)
The percentage of your account you're willing to lose if the stop-loss is hit. Default is 2%. On a $10,000 account at 2%, each losing trade costs $200. Adjust between 0.1% and 10% based on your risk tolerance.
Leverage (x)
The leverage you're using on your exchange. Default is 10x. Set to 1 for spot trading, up to 125 for futures. Leverage does not change your risk — it only changes how much margin you need to deploy.
How the Dashboard Uses These Numbers
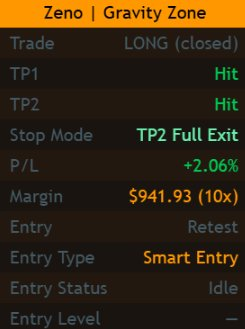
Once you've configured all three, look at the Margin row on the dashboard. This number tells you exactly how much capital you need to deploy to enter the next trade at your configured risk level.
The dashboard updates in real time as market conditions change:
When a trade is active — the margin shown is what you've already deployed for the current position.
When a signal is pending (fib zone drawn, waiting for fill) — the margin shown is what you'll deploy when price hits the entry level.
When no trade is active — the dashboard estimates what margin you'd need if a signal fired at current market conditions, so you always know in advance.
The indicator calculates your position in four steps, all automatic:
1. Risk Amount = Account Size × Risk % (e.g. $10,000 × 2% = $200)
2. Stop Distance = Entry price − Stop-loss price (in dollars)
3. Position Size = Risk Amount ÷ Stop Distance (in units of the asset)
4. Margin = (Position Size × Entry Price) ÷ Leverage (your actual capital deployed)
This means your dollar risk stays constant regardless of leverage. Leverage only determines how much margin you tie up — not how much you can lose.
Higher leverage does not mean higher profit in this system. Since position size is fixed by your risk %, leverage only changes the margin you commit. Higher leverage = lower margin tied up, same dollar risk. Lower leverage = more margin tied up, same dollar risk.
Never increase your Risk Per Trade just to see bigger Margin numbers. Stick to 1–2% per trade. The compounding over hundreds of trades is what builds equity — not the size of any single position.
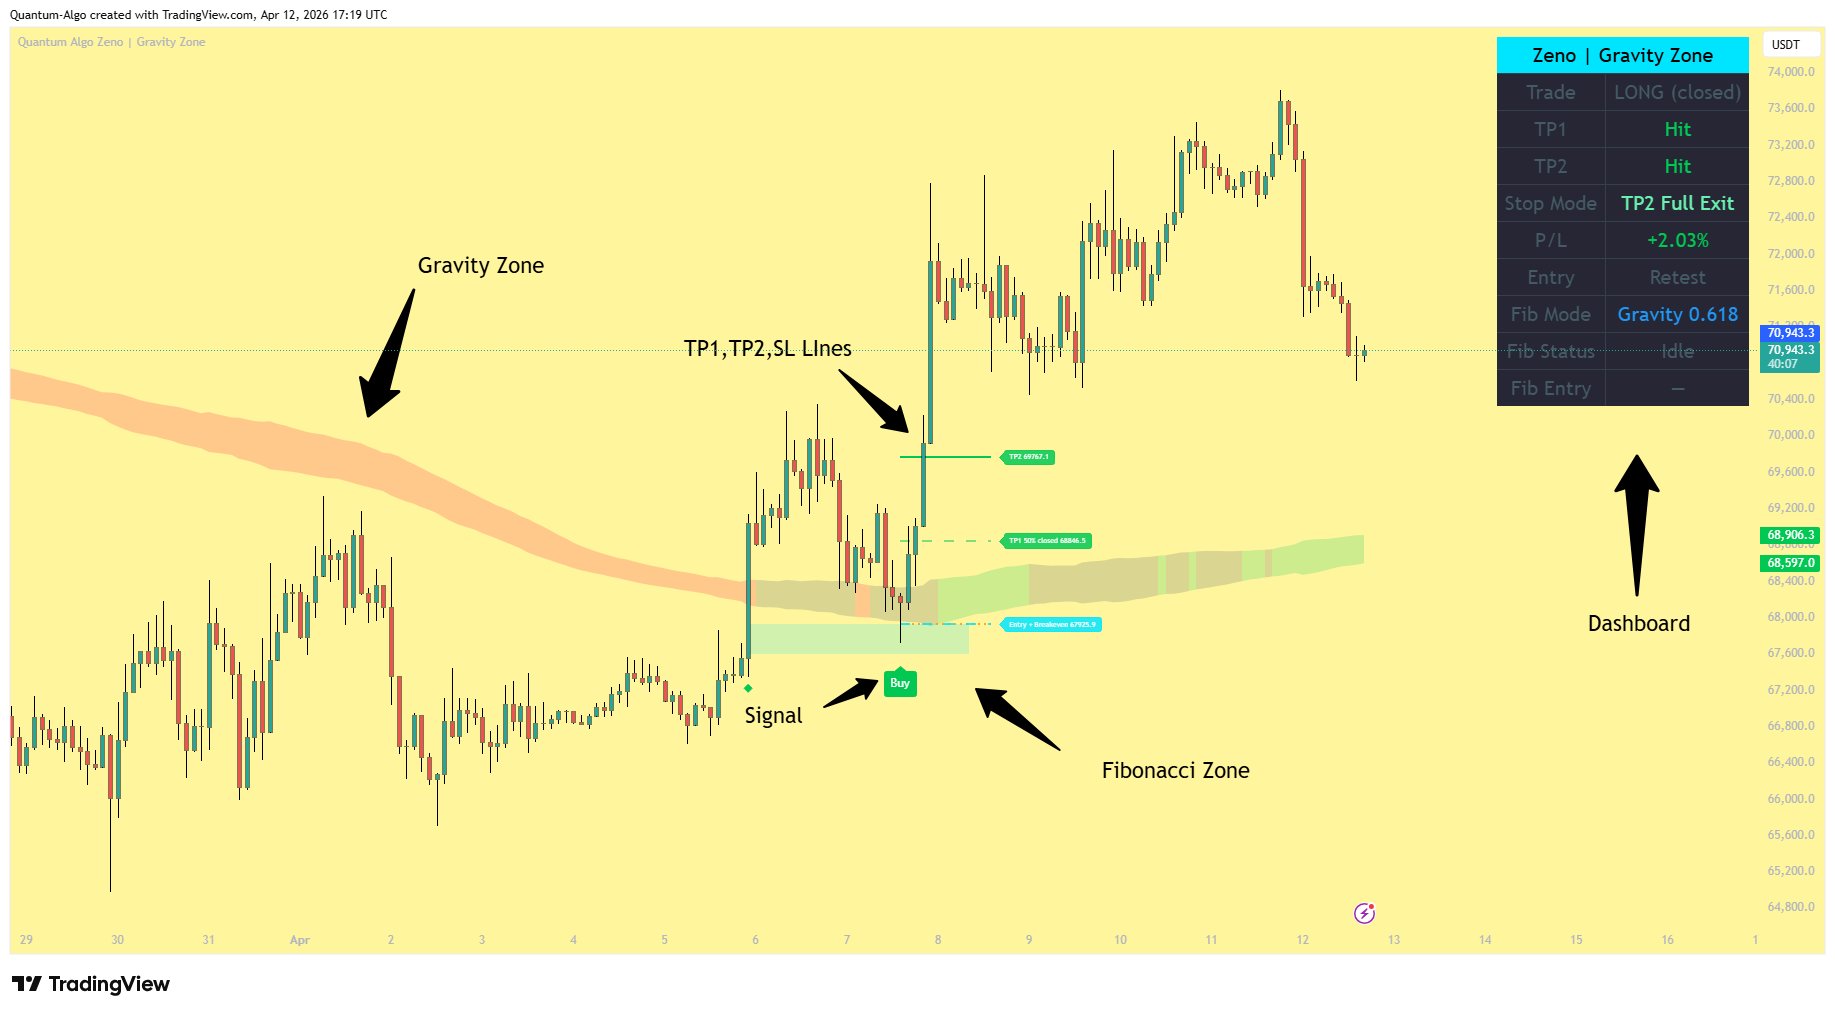
What You See on the Chart
The Gravity Zone
A semi-transparent band around the gravity level. Width and opacity are configurable. Color changes with the underlying structure — green when rising, red when falling, gray when flat.
Entry Zone
A cyan box that marks the optimized entry area. Appears when confluence fires and stays visible after the trade fills so you can see the relationship between your entry and the structure.
Trade Lines
| Line | Color | Style |
|---|---|---|
| Entry | Orange | Dotted — with orange background label |
| Stop Loss | Red | Solid — disappears when SL moves to breakeven |
| Breakeven | Cyan | Dashed — appears at entry price when TP1 hit |
| TP1 | Green | Dashed after hit, solid before |
| TP2 | Green | Dashed after hit, solid before |
Labels
All labels have solid colored backgrounds for visibility on any chart theme:
ENTRY — Orange box with white text at entry price.
Entry + Breakeven — Cyan box when SL moves to entry.
SL — Red box at stop-loss level.
TP1 / TP2 — Green boxes at take-profit levels.
Buy / Sell — Large label at the signal bar.
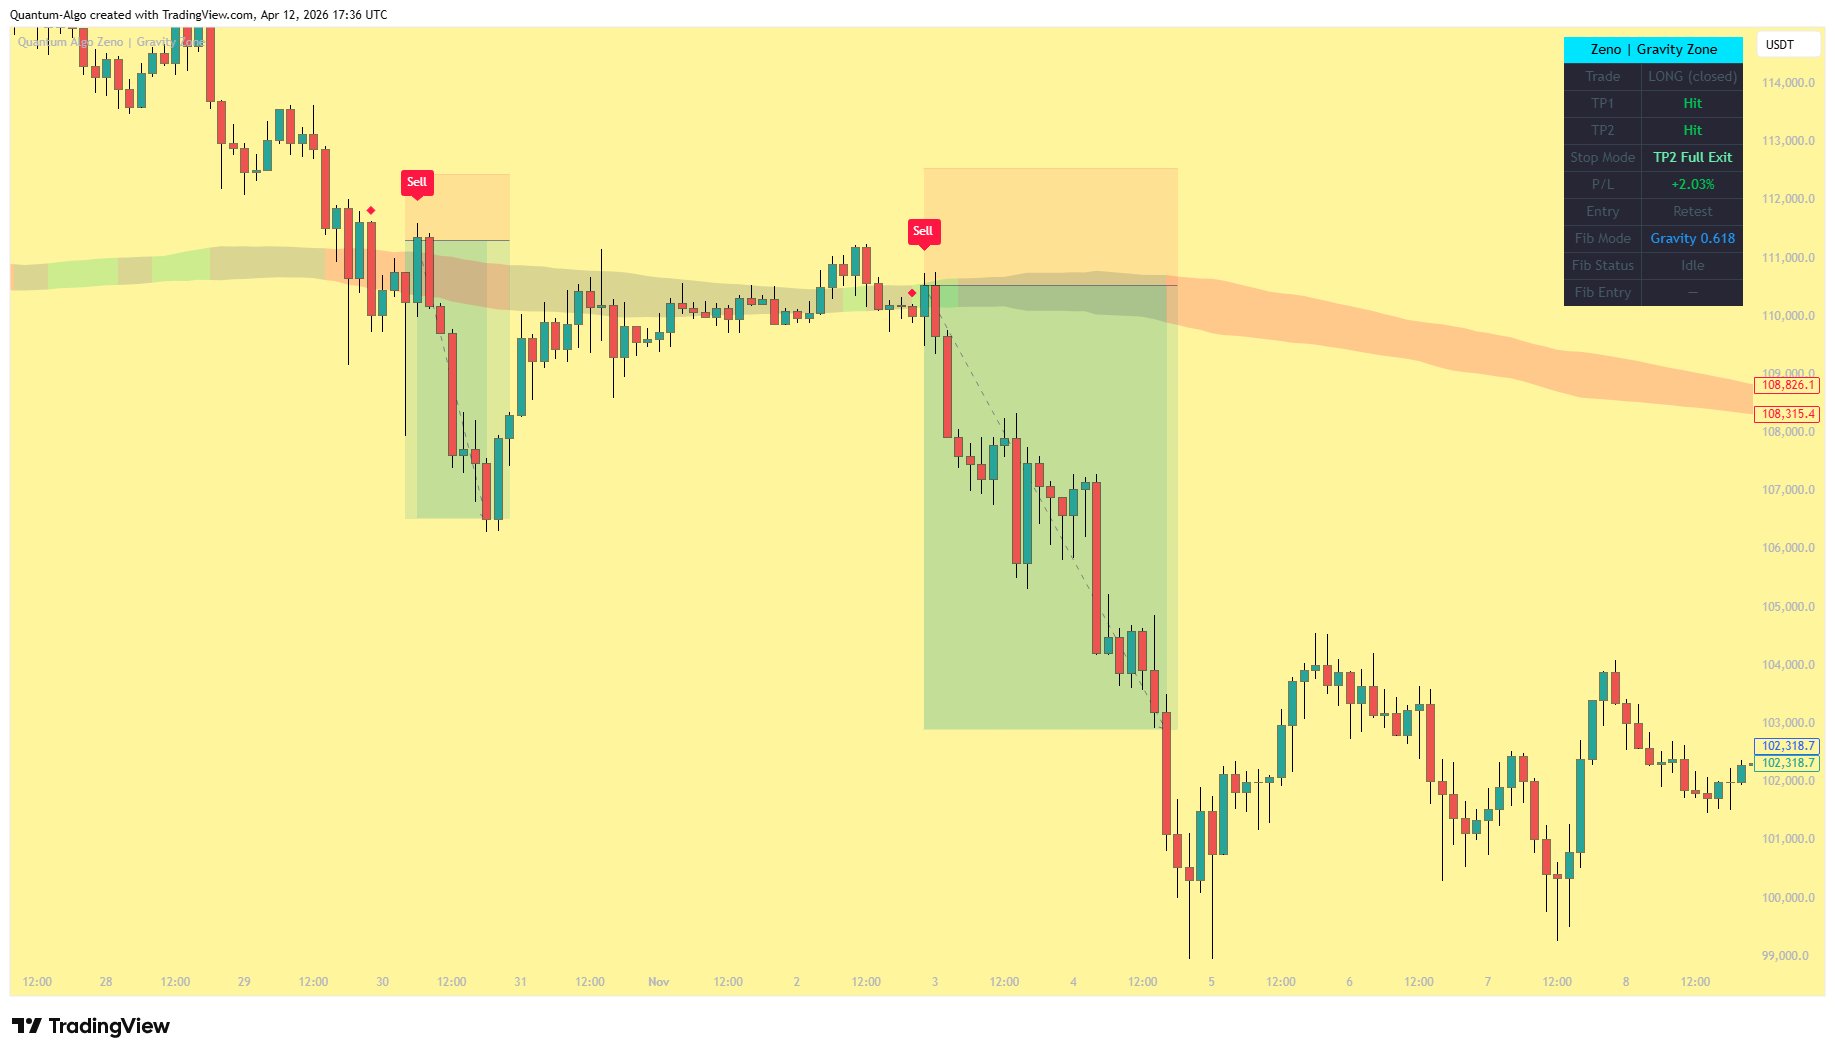
Zeno | Gravity Zone Dashboard
The dashboard sits in the top-right corner (configurable) and shows real-time trade status and P/L. Size is adjustable from tiny to large.
Dashboard Rows
| Row | What It Shows |
|---|---|
| Header | Zeno | Gravity Zone — orange background, centered |
| Trade | LONG / SHORT / FLAT — with color-coded background |
| TP1 | Price level or "50% closed" when hit |
| TP2 | Price level or "Hit" when reached |
| Stop Mode | SL Active / BE Locked / Exited BE / Exited SL |
| P/L | Current or last trade percentage — green for profit, red for loss |
| Margin | Margin required for the trade at your configured leverage — e.g. $677.20 (10x) |
| Entry Mode | Pullback Retest / First Touch / Watching |
| Entry Type | Optimized / Direct (or your configured setting) |
| Entry Status | Idle / Filled |
You can enable or disable individual dashboard sections: Trade / TP / SL / P&L, Elite Filters, and Entry Status. By default only the Trade and Entry sections are shown to keep it clean and focused.
Advanced Signal Filtering
Beyond the core confluence system, Gravity Zone offers additional filters you can enable to further refine entries. These are off by default (except Volume Spike) so you can progressively tighten your criteria.
Trend Strength Filter
Only take trades when the market is trending. Filters out choppy, ranging conditions where gravity zone strategies underperform.
Volume Spike Filter
Enabled by default. Requires elevated participation before signaling. Ensures institutional presence is confirmed — not just retail noise.
Multi-Timeframe Trend
Checks if the higher timeframe structure agrees with your trade direction. Prevents trading against the higher timeframe trend.
Session Filter
Skip Asian session (low liquidity) or restrict to US/EU sessions only. Useful for forex and crypto where session matters for volatility and spread.
Order Flow Filter
Measures buying vs selling pressure. Ensures the order flow direction matches your trade — buy only when net buying, sell only when net selling.
Two Stop Management Strategies
Gravity Zone offers two stop management modes. Choose the one that matches your trading style.
Trail + BE
When TP1 is hit, SL moves to breakeven and a trailing stop activates. The trail follows price at a configurable volatility-based distance. Good for trending markets where you want to capture extended moves beyond TP2.
Best for: Trending conditions, higher timeframes.
Risk: Trailing stops can get clipped by wicks in choppy markets.
50% Close + BE
When TP1 is hit, 50% of the position closes (locking profit) and SL moves to breakeven. The remaining 50% rides to TP2 or exits at breakeven. No trailing — simple and predictable.
Best for: Crypto, choppy markets, lower timeframes.
Default mode. More consistent results, less exposed to wick noise.
Step-by-Step Strategy
Add Gravity Zone to Your Chart
It appears directly on the price chart as an overlay. The gravity zone band is immediately visible around the gravity level. Configure zone opacity to suit your chart theme.
Set Your Risk Parameters
Open settings and configure Account Size and Risk Per Trade. The SL/TP multipliers are backtested — adjust only if you understand the impact on R:R.
Watch for Confluence Diamonds
When the indicator detects a valid setup, a small diamond shape appears below (long) or above (short) the candle. This means the confluence check passed and the entry zone is being drawn.
Wait for the Fill
Don't chase. The cyan entry zone shows where the optimal entry is. Let price retrace to it naturally. If it doesn't reach the level within the expiry window, the setup expires and you lose nothing.
Trade Is Active
When the entry level is touched, a Buy/Sell label appears and lines are drawn. Check the dashboard for your margin requirement, SL, and TP levels.
Let the System Manage
Close 50% at TP1. SL moves to breakeven automatically. Ride the remaining 50% to TP2 or breakeven exit. The dashboard tracks everything in real-time.
Backtesting confirms the 2-hour (2H) timeframe delivers the best results with this strategy — backtested win rate of 87% on the 2H timeframe. The gravity zone is most respected on this timeframe. It also works on 1H and 4H, but with lower consistency. On very low timeframes (1m, 3m), the gravity zone may not hold institutional significance. For best results, enable the Volume Spike filter and use 50% Close + BE mode. If you're trading crypto, consider enabling the Session Filter to skip Asian hours when liquidity is thin.
Zeno Oscillator vs. Gravity Zone
Both indicators are part of the Zeno family but serve completely different strategies. They can be used independently or together for maximum confluence.
Zeno (Oscillator)
Strategy: Momentum-based reversals
Lives: Separate pane below chart
Entry trigger: Momentum signals and correlation alerts
Entry method: Immediate at signal bar close
Best for: Catching momentum exhaustion and reversals
Risk: Volatility-based SL / TP1 / TP2
Gravity Zone (Overlay)
Strategy: Gravity zone structure + smart optimized entry
Lives: Price chart overlay
Entry trigger: Multi-factor confluence at gravity level zone
Entry method: Smart optimized entry
Best for: High-probability entries at institutional levels (best on 2H)
Risk: Volatility-based SL / TP1 / TP2
Add both to the same chart. When Gravity Zone fires a confluence near the gravity level AND Zeno shows a momentum signal at the same time, you have dual-system confirmation — structure + momentum agreeing. These are the highest-probability setups. For best results, run both on the 2-hour timeframe.
Settings Reference
Zone Width & Opacity
Zone width and opacity are fully adjustable. Bullish, bearish, and neutral colors are independently configurable.
Pullback Retest vs First Touch
Retest mode waits for price to leave and return to the zone. First Touch enters immediately. Retest is more filtered and recommended.
Optimized Entry Settings
Enable/disable optimized entry, adjust swing lookback and expiry bars. Minimal drawing style shows just the cyan zone box.
Stop Loss & Take Profit
All volatility-based. Default multipliers are backtested and optimized for the 2H timeframe. Account size and risk % determine position sizing.
Sections & Size
Toggle individual dashboard sections on/off. Size from tiny to large. Trade and Entry sections are shown by default.
Colors & Line Width
Every color is customizable — bullish, bearish, entry (orange), TP (green), SL (red), entry zone (cyan), trailing (green). Line widths adjustable 1-4.